Equity Insights
In a nutshell
- Earnings remain an important support for equity markets, but higher bond yields have raised the hurdle for further gains. With less valuation cushion available, continued returns increasingly depend on the durability of earnings and whether productivity gains can broaden profit growth beyond the current AI leaders.
- The AI cycle is moving from build out towards monetisation. Elevated capex can remain economically attractive, but utilisation, pricing and the ability of new capacity to generate recurring revenues and cash flows are becoming more important than the headline level of spending.
- Market leadership has broadened geographically without necessarily becoming less concentrated economically. Several markets remain exposed to the same global semiconductor and AI infrastructure cycle, making the underlying source of earnings more important than index geography alone.
- The next phase is likely to favour greater selectivity within and beyond AI. Enablers can continue to participate, while AI adopters and companies with independent earnings drivers may provide additional sources of growth without relying on the same capex cycle.
- Opportunities beyond the current leaders remain differentiated rather than uniform. Emerging markets combine AI exposure with structural themes such as energy transition, industrialisation and financial inclusion, while wide valuation dispersion increases the importance of country, sector and stock selection.
Beyond AI leadership
Equity markets are still being supported by strong earnings, but higher bond yields and concentrated leadership are raising the bar for the next phase of returns.
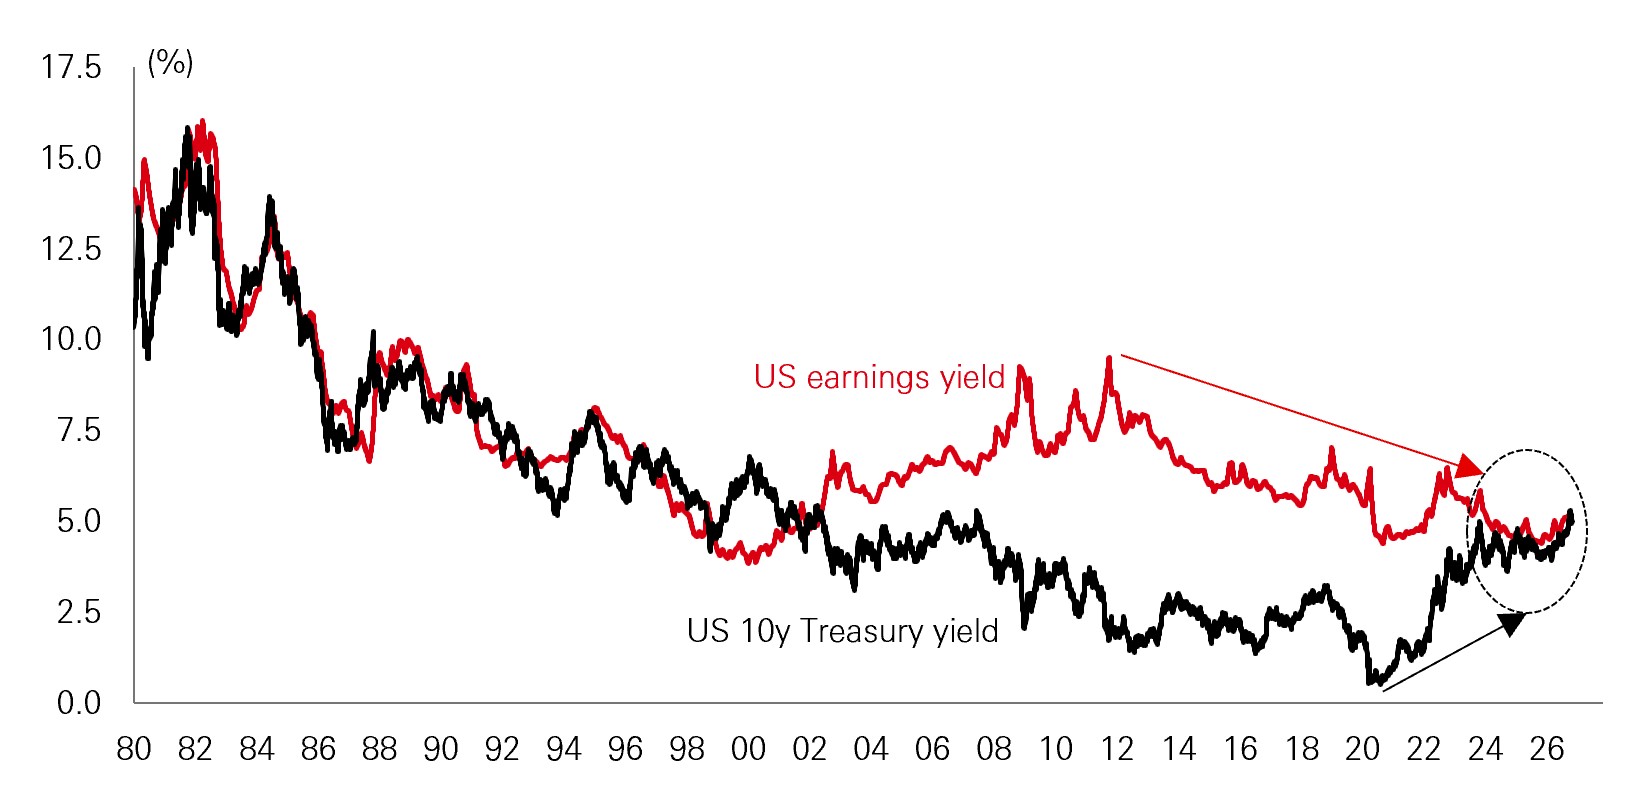
Earnings delivery remains at the heart of the equity market story. After an exceptionally strong Q2, early Q3 results point to some moderation. Blended Q3 earnings growth is currently around 29 per cent, still strong in absolute terms but below the 52 per cent pace seen in Q2. Yet the backdrop is becoming less forgiving. Higher government bond yields have compressed the equity risk premium, raising the return hurdle investors require to take on additional equity risk.
Figure 1: US 10y yield versus 12m forward S&P 500 earnings yield
Click the image to enlarge
Past performance does not predict future returns.
Source: Refinitiv, LSEG, IBES, MSCI, HSBC Asset Management, September 2026.
The situation places more of the burden on profits. With real yields and term premia higher, equity valuations have less room to expand independently of earnings. From here, earnings increasingly need to grow faster than prices if valuations are to remain supported, putting greater focus on where those earnings are coming from.
Equity performance has broadened from the very narrow cohort seen in early 2025, but parts of that broadening remain closely tied to the AI investment cycle. Korea and Taiwan have benefited from exceptional semiconductor demand, while technology accounts for around three quarters of this year’s emerging market profit growth. This is not the same as a conventional broad based EM earnings recovery because much of the improvement still reflects exposure to the global AI capex cycle.
As concentration increases, that distinction becomes more important. Technology weights in several Asian markets have risen sharply over the past decade, making country level equity performance increasingly sensitive to the same underlying investment driver.
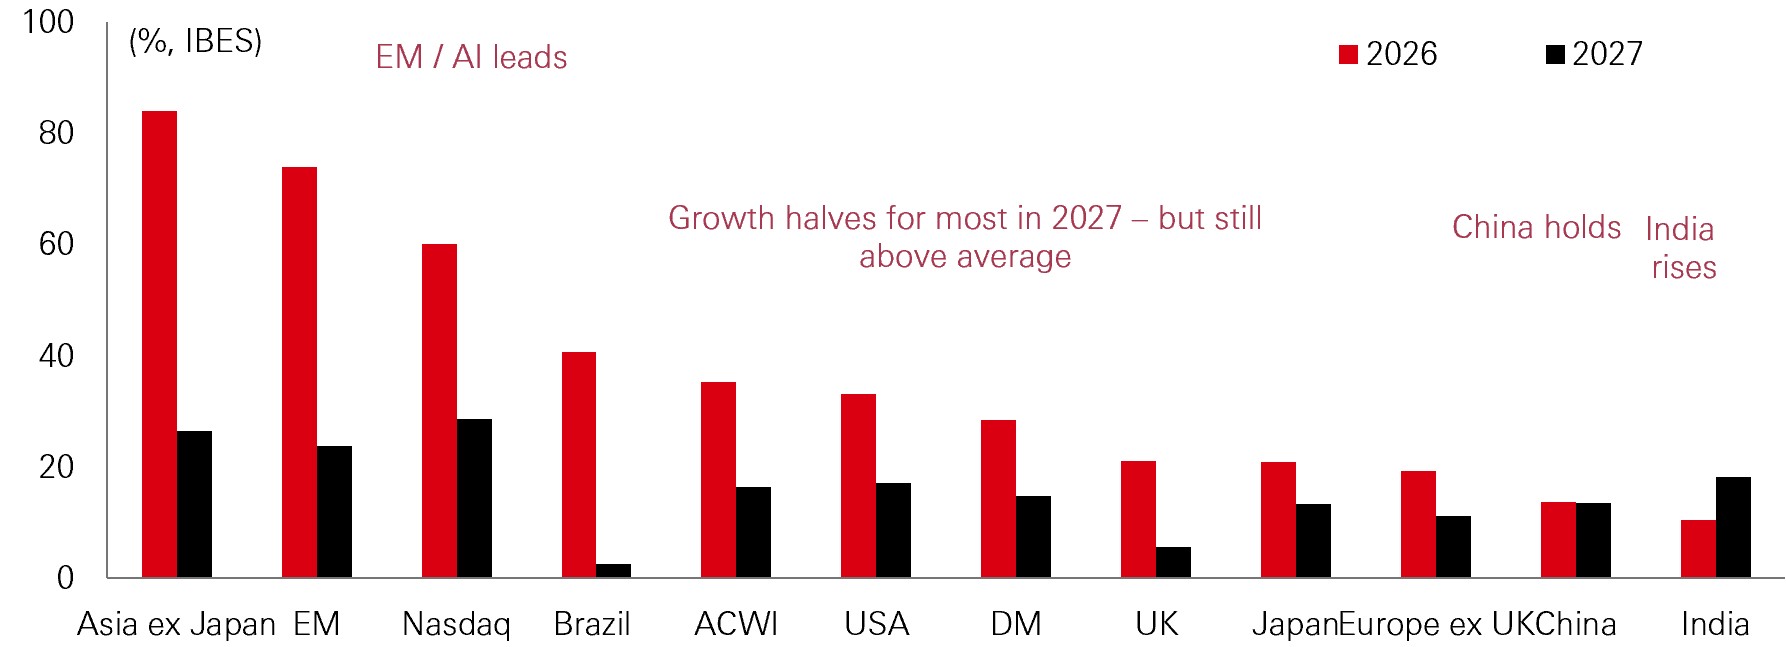
There are nevertheless signs that the picture could become more balanced. Consensus expects earnings growth to moderate across most markets in 2027, although China is expected to remain relatively stable and India to improve after a difficult period. Defensive sectors such as healthcare, real estate and consumer staples also show steadier earnings profiles as some of the exceptional growth elsewhere begins to normalise.
The important point is not that technology stops growing. Rather, the gap between the strongest AI linked markets and the rest of the equity universe begins to narrow. Technology is still expected to deliver strong profit growth, but the unusually high rates recorded in some semiconductor heavy markets become increasingly difficult to repeat. If earnings growth becomes less concentrated, market returns could broaden with it, with firmer earnings in markets such as India and more stable growth in China adding to the range of earnings drivers.
Figure 2: Global country consensus EPS growth estimates for 2026 and 2027
Click the image to enlarge
Past performance does not predict future returns.
Source: Refinitiv, IBES, HSBC Asset Management, September 2026.
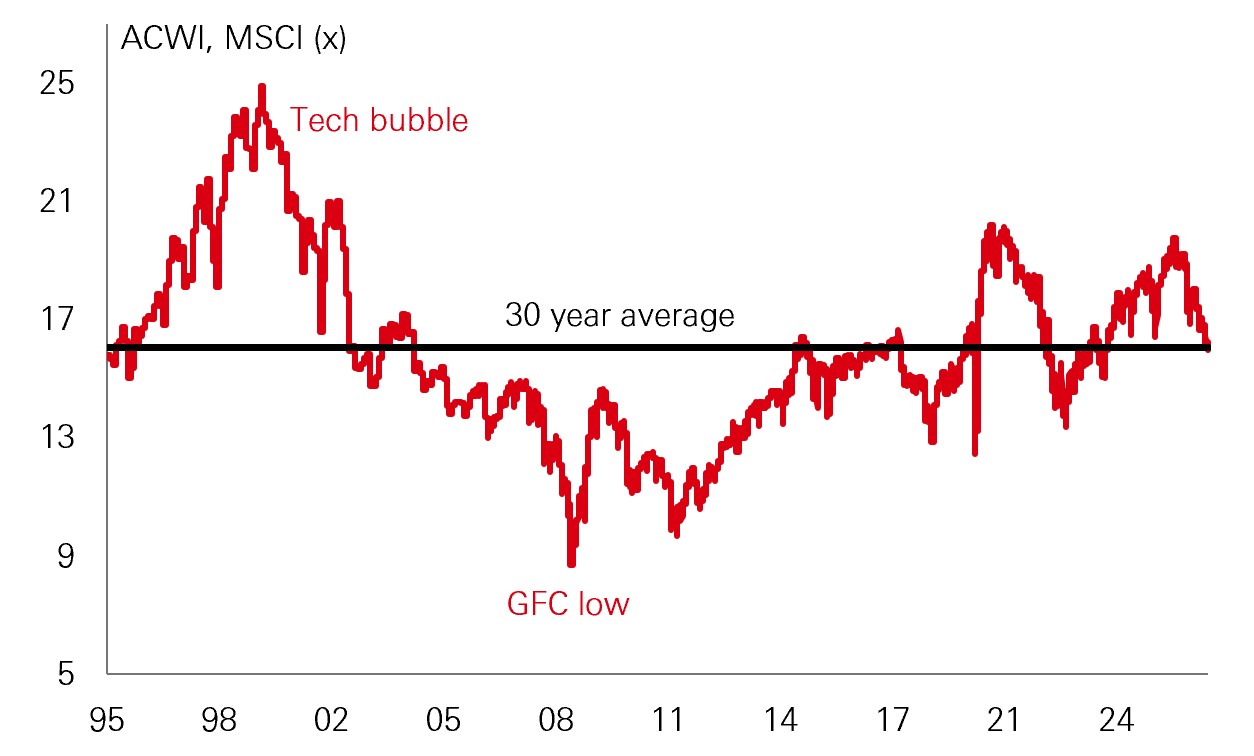
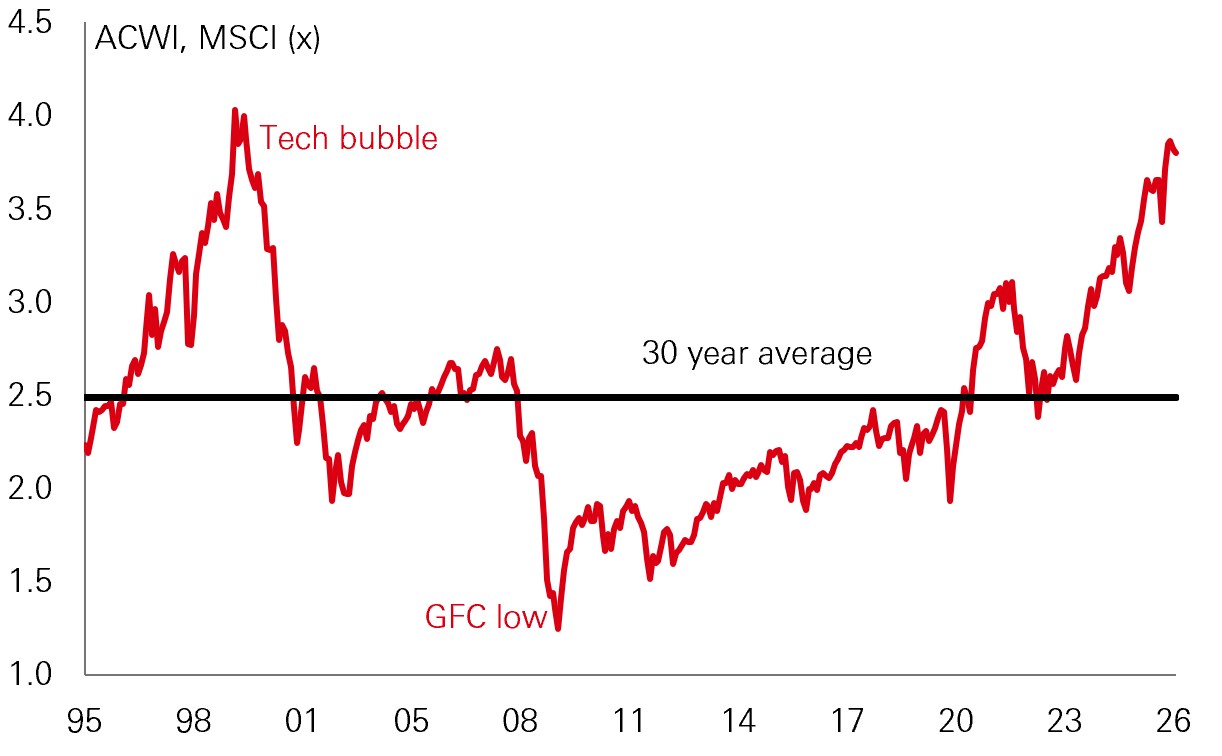
Valuations reinforce the need to look beneath the headline. Global forward price-to-earnings multiples remain close to long run averages, partly because earnings have risen so quickly. Price-to-book measures tell a less comfortable story, with valuations in some of the biggest AI beneficiaries approaching levels last seen around the technology bubble. Korea and Taiwan, for example, can still appear inexpensive on earnings based measures while looking much richer relative to their asset base. China and India sit at the other end of that spectrum, with price-to-book valuations that are less stretched relative to their own history.
Strong earnings can keep forward P/E ratios looking reasonable even as the price investors are paying for the underlying asset base rises sharply. The apparent valuation cushion therefore depends increasingly on earnings continuing to deliver. Earnings growth does not necessarily need to accelerate further, but elevated expectations following exceptionally strong profits can leave valuations more vulnerable if earnings disappoint.
Figure 3: 12m forward price to earnings for global equities (x)
Click the image to enlarge
Figure 4: 12m price to book for global equities (x)
Click the image to enlarge
Past performance does not predict future returns.
Source: Refinitiv, LSEG, IBES, MSCI, HSBC Asset Management, October 2026.
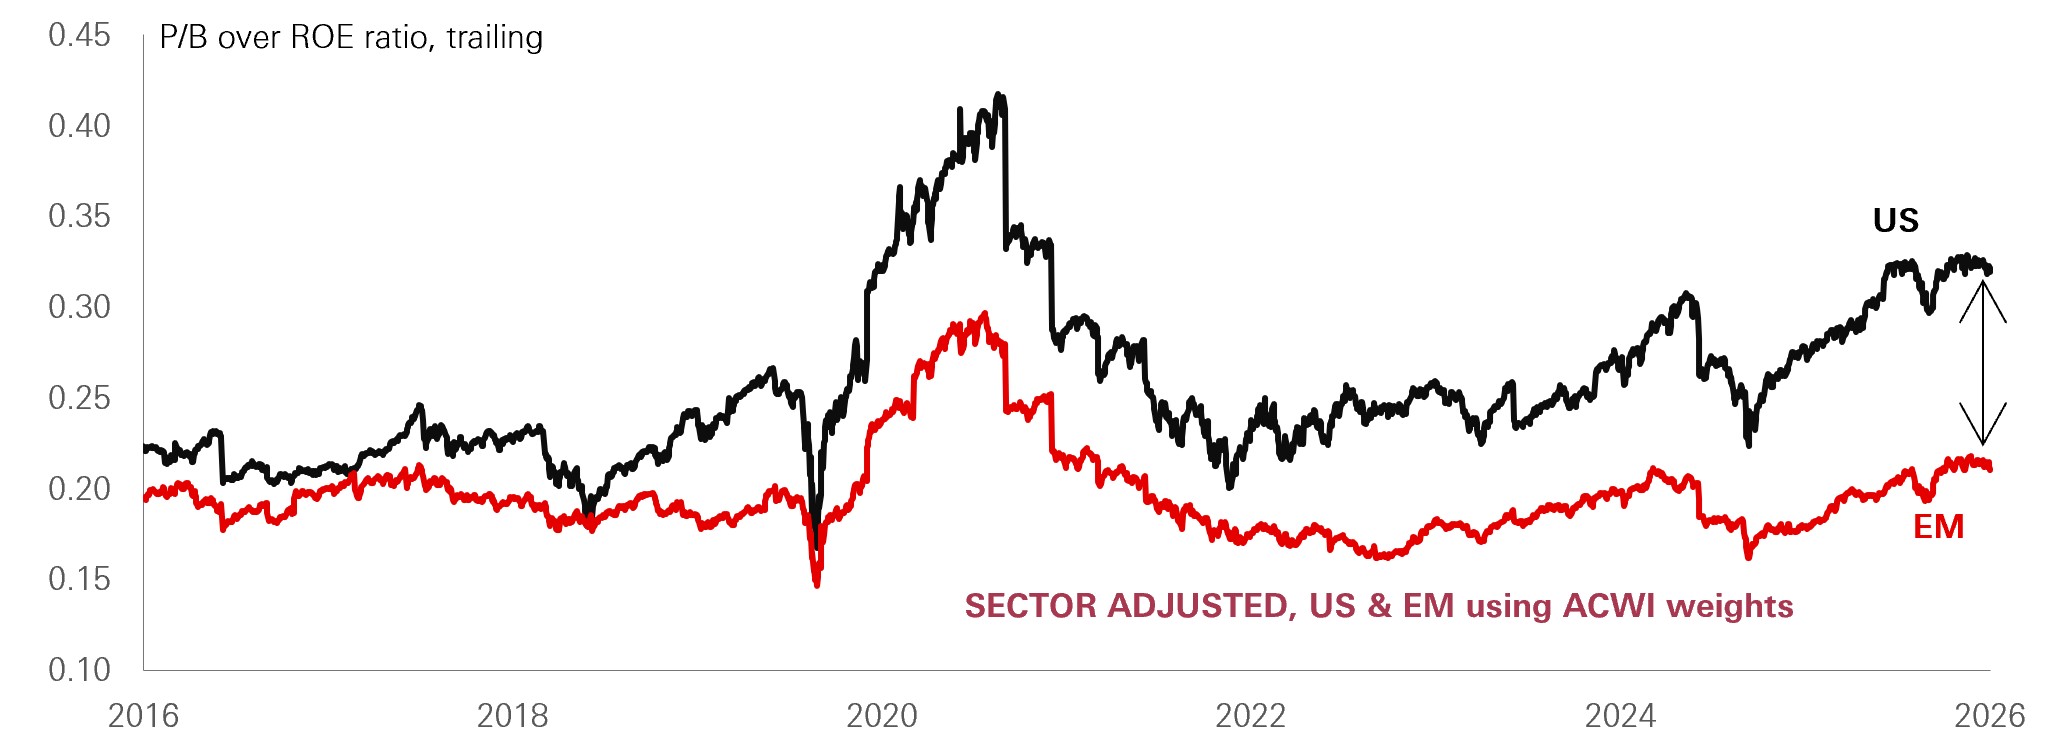
There is also considerable dispersion beneath regional indices. Once sector differences are neutralised, emerging markets continue to offer a lower price for a given level of profitability than the US. On a sector neutral basis, the price paid for a unit of return on equity in the US is around 50 per cent higher than in emerging markets. This suggests that some of the valuation opportunity remains obscured by the increasing weight of technology within headline EM indices.
Figure 5: Trailing price-to-book over ROE ratio
Click the image to enlarge
Past performance does not predict future returns.
Source: Refinitiv, LSEG, IBES, MSCI, HSBC Asset Management, September 2026.
From investment to monetisation
This brings the focus back to AI. With so much earnings momentum now linked directly or indirectly to the investment cycle, the next phase depends less on how much capex is announced and more on whether the infrastructure being built generates the revenues, productivity and cash flows needed to sustain it.
There are already signs of that shift. Older cloud contracts are being repriced in a much stronger demand environment, newer generations of chips are increasing the amount of inference that can be delivered, and the composition of capex is moving towards revenue generating compute rather than simply land, power and data centre shells. AI is also pulling through demand across existing cloud and software businesses, meaning the return on investment cannot be measured only through revenues explicitly labelled as AI.
The composition of spending is therefore becoming as important as its absolute size. Some of the recent increase in capex has reflected higher component costs rather than an equivalent increase in productive capacity. Longer term component agreements can reduce some of that volatility, while a growing share of investment is now shifting towards compute that can begin generating revenue once installed. The revenue potential of each additional dollar of capex may therefore improve even while headline spending remains elevated.
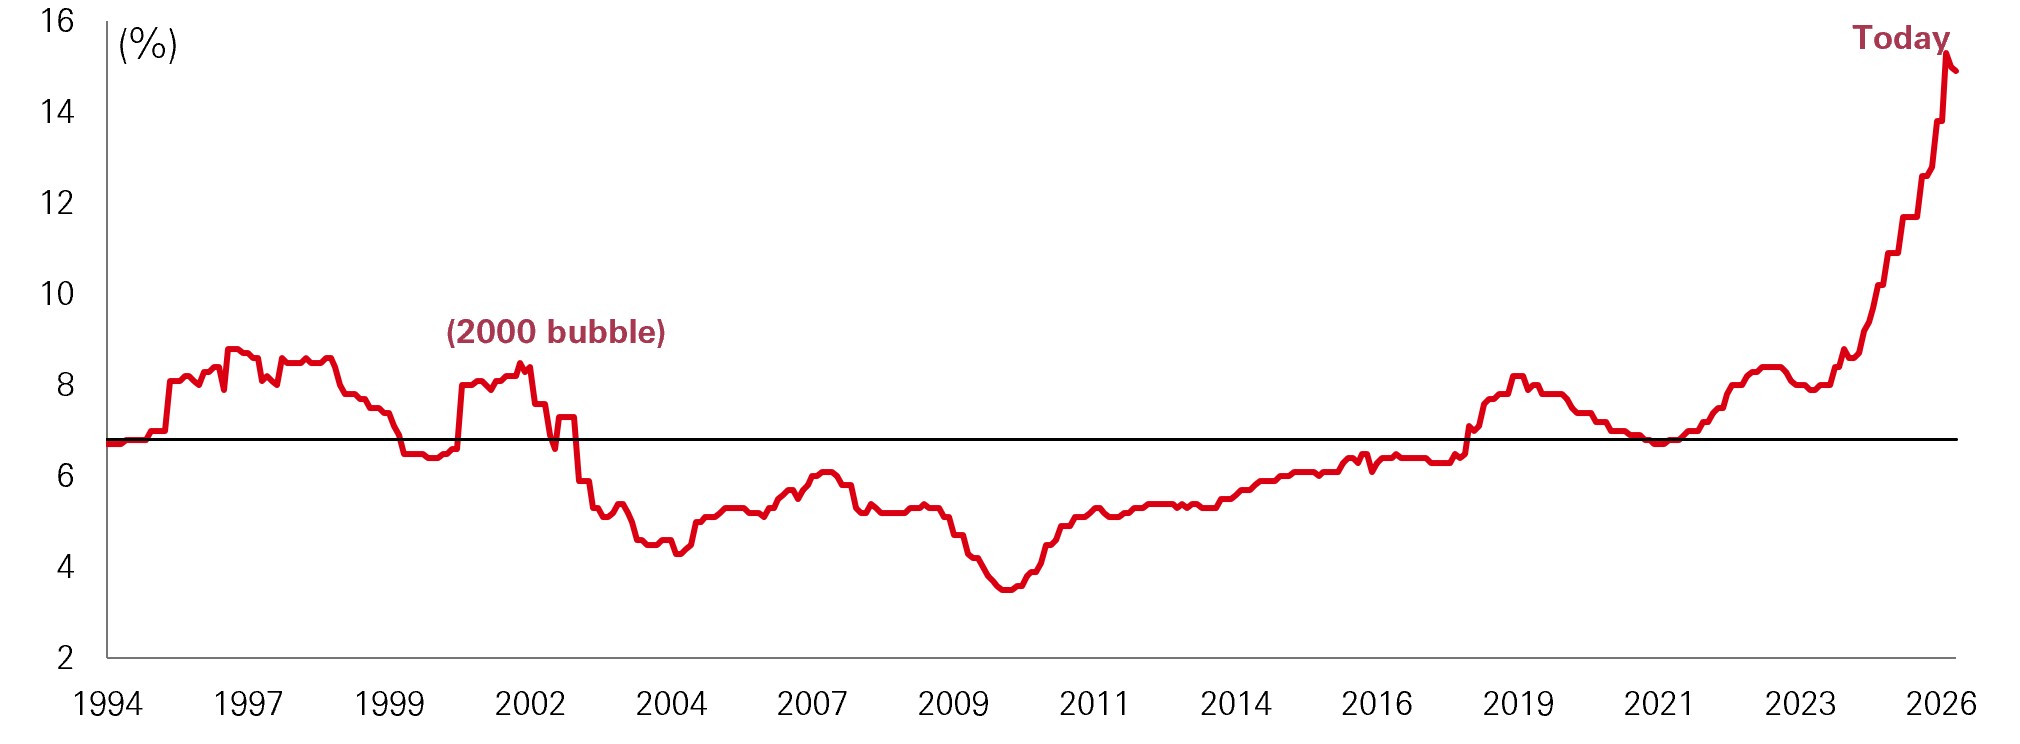
This also changes how the capex-to-sales relationship should be interpreted. A gradual moderation in capex intensity alongside stronger sales would indicate that monetisation is beginning to catch up with investment. By contrast, a sharp collapse in spending would carry a very different signal. The healthier path is not simply lower capex, but a transition in which revenues increasingly absorb the investment already made.
Figure 6: US capex to sales (per cent)
Click the image to enlarge
Past performance does not predict future returns.
Source: Refinitiv, LSEG, IBES, MSCI, HSBC Asset Management, September 2026.
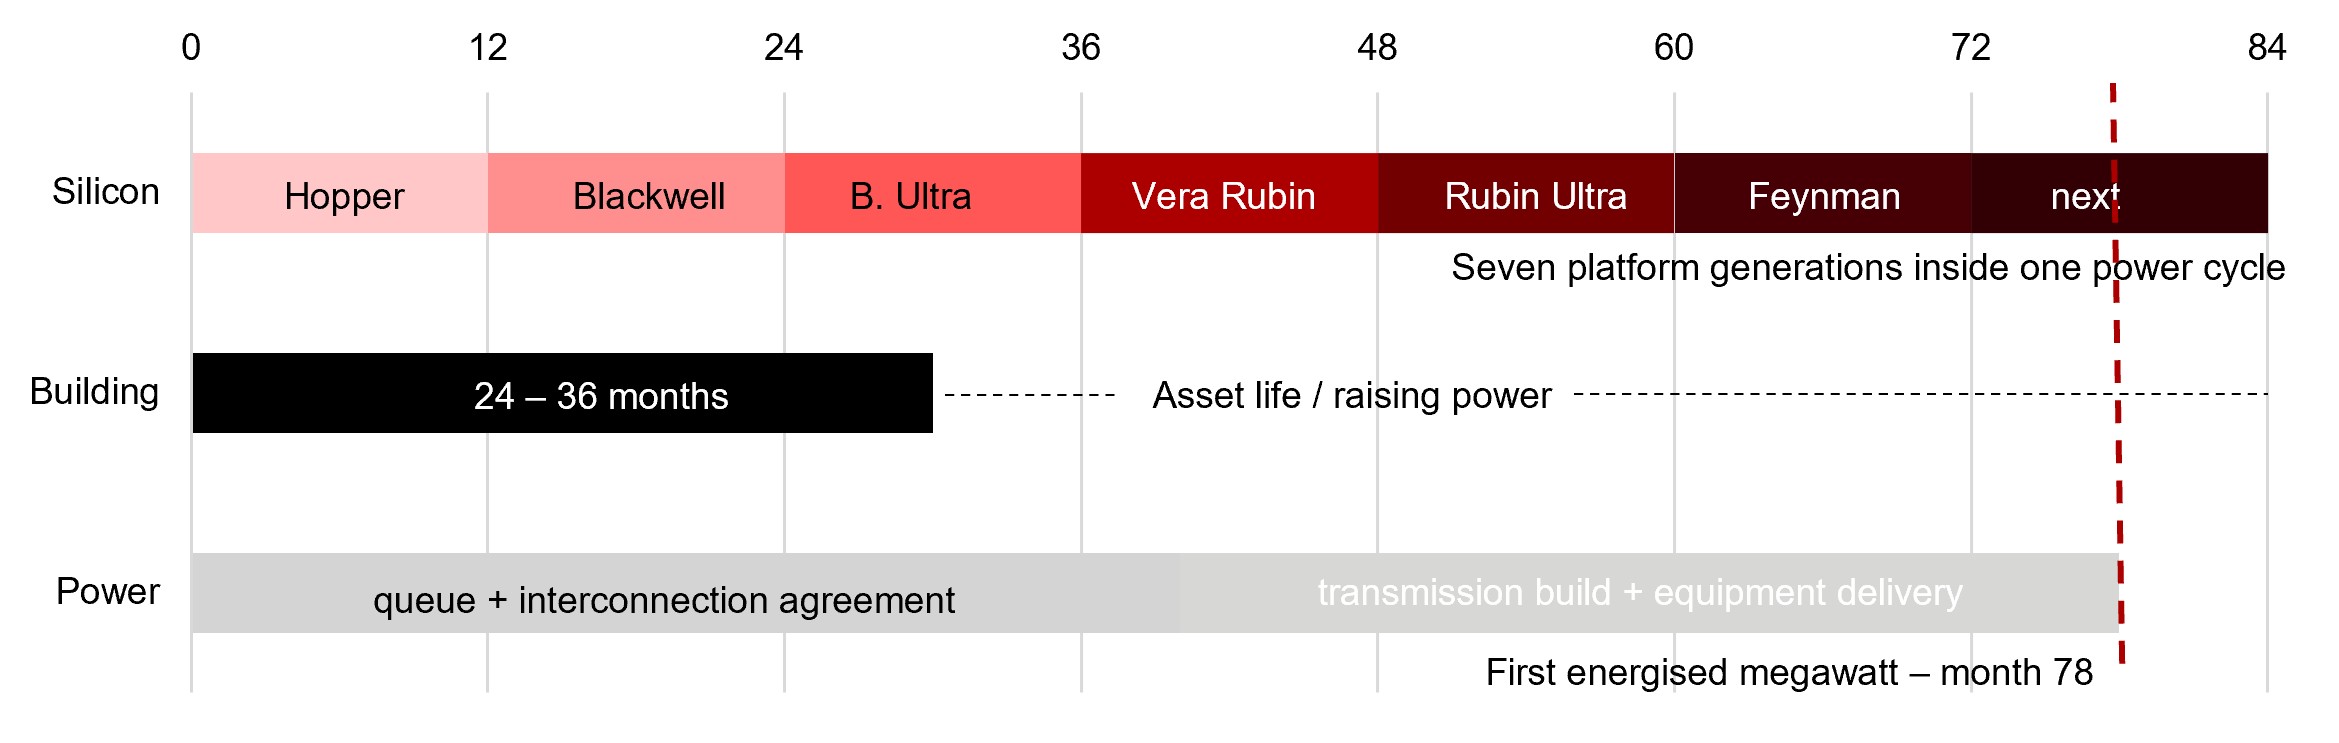
One way to understand the economics of the AI build out is through its three different investment clocks. The first is silicon – chips and servers – which can move through technology cycles in roughly a year. The second is the data centre building itself, where construction can take around two to three years but the underlying shell, cooling and network infrastructure can support several generations of compute. The third is power, where securing grid connections and bringing new capacity online can take considerably longer. A single power development cycle can therefore span several generations of chips.
Figure 7: Three clocks – the mismatch that defines the cycle
Click the image to enlarge
Source: Data Gravity Substack, HSBC AM, September 2026.
That timing mismatch helps explain why headline capex can look unusually high. Hyperscalers are investing simultaneously in short duration compute and physical infrastructure with much longer economic lives. Compute hardware accounts for roughly 60 per cent of the cost of a data centre, while the remainder goes into buildings, power systems, cooling and network connections. Assessing the entire investment against the replacement cycle of GPUs therefore risks overstating the capital burden because much of the supporting infrastructure can be used across multiple generations of technology and workloads.
Illustrative modelling suggests that, with high utilisation, the economics can remain attractive. Potential data centre returns could reach around 19–20 per cent, while server payback periods could be roughly three years. These estimates are assumptions rather than guaranteed outcomes, but they help explain why hyperscalers remain willing to invest while demand remains visible.
The more important uncertainty is therefore utilisation rather than the headline cost of capacity. If demand develops as expected, infrastructure can move from a period of heavy upfront spending into one of stronger revenue and cash flow generation. If demand is slower, lower utilisation extends payback periods and projects can be delayed, resized or cancelled.
Demand becomes the harder variable
Project announcements suggest capex could continue rising through 2028, although hyperscalers retain meaningful flexibility over the pace of development. The next stage increasingly depends on whether durable demand emerges quickly enough to fill that capacity.
Token prices are one indicator, but they need to be interpreted carefully. A cheaper model may consume more tokens to complete the same task, while enterprise users can pay different prices depending on where workloads are hosted. Falling unit prices therefore do not automatically translate into weaker infrastructure revenues. The relevant economic measure is closer to the total cost of completing a workload and the level of utilisation generated.
Near term conditions remain supportive because compute is scarce. Over a longer horizon, however, greater model competition and lower cost alternatives could put pressure on pricing. The interaction between price and usage then becomes central because lower unit costs may stimulate sufficiently strong demand to offset some of the effect on pricing, but the extent to which that occurs remains uncertain.
Funding adds another layer of uncertainty. A meaningful share of future capacity is being committed to a relatively small number of frontier model developers. That means part of the investment cycle ultimately depends not only on end user demand, but also on the ability of those developers to continue raising capital and converting rapidly rising usage into sustainable revenues.
Regulation and policy can influence the same economics. Restrictions affecting power, data centre development, model access or technology supply could change the timing and location of investment, while competition between US and Chinese models could alter the pricing structure over time.
These risks do not necessarily undermine the near-term investment cycle. They do, however, create open questions around the durability of margins and the pace of monetisation. With valuations already assuming substantial earnings delivery in parts of the market, news around funding, demand or policy can therefore generate volatility even if the broader AI investment case remains intact.
The complexity within the technology stack itself is also increasing. What once appeared to be a relatively simple relationship between more compute and more demand for memory or semiconductors increasingly depends on model architecture, training versus inference, latency requirements and the type of compute being deployed.
As the technology matures, stock selection is therefore likely to become more important even within the group of companies commonly described as AI beneficiaries.
Broadening beyond the enablers
The next phase is likely to be more selective than the broad AI trade of recent years. As the technology matures, differences in utilisation, funding, pricing power, architecture and business model should become more important. The investment cycle can remain strong without every company in the ecosystem benefiting equally, while disappointments around demand, financing or policy could periodically test valuations that already assume substantial earnings delivery.
For investors, this raises a broader question: if AI remains an important engine of market returns but concentration itself is becoming a risk, where can they find additional sources of earnings that are genuinely different rather than simply less exposed to technology? The answer is not necessarily to move mechanically into whatever has lagged. Concentration can be reduced in several ways, but the fundamental drivers still matter.
A useful way of looking through that concentration is to separate companies according to whether they primarily enable AI infrastructure, adopt the technology or face potential disruption from it. This helps distinguish genuine diversification from a simple change in sector or market cap exposure. When applied to major equity benchmark, AI enablers in particular punch well above their weight in driving returns and earnings.
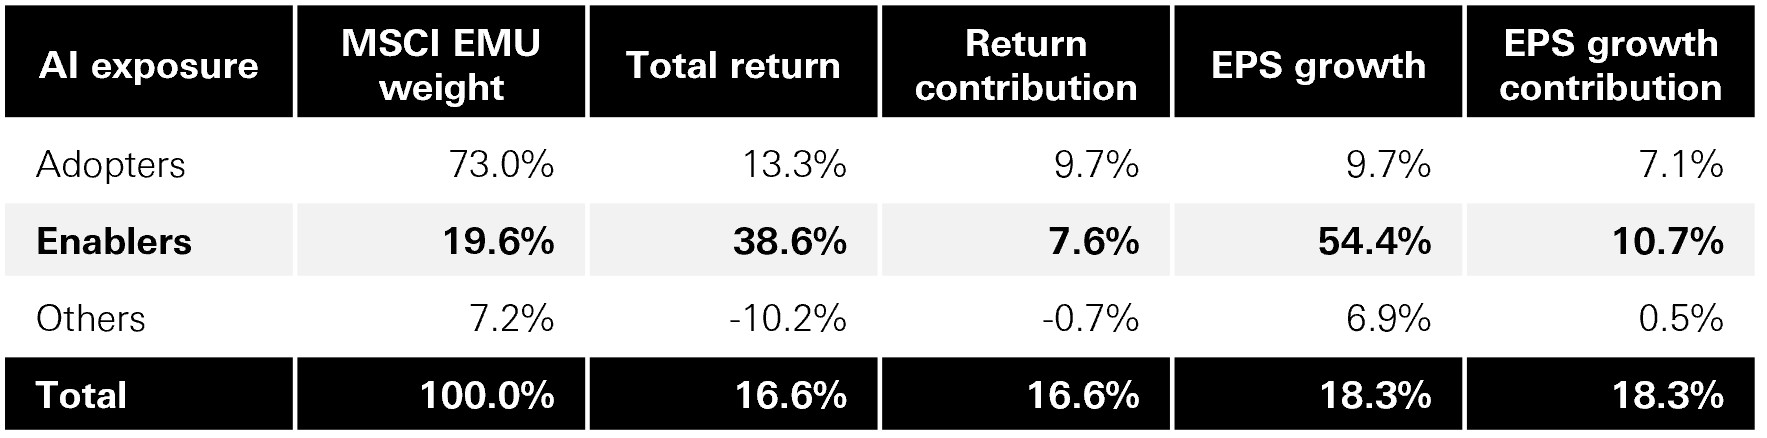
AI enablers already account for a disproportionate share of performance in some markets. In the MSCI EMU, for example, they represent roughly 20 per cent of the index but have generated close to half of equity returns and more than half of earnings growth. That illustrates how exposure to AI can be much larger economically than its headline index weight suggests.
Figure 8: AI contribution to European equity returns and earnings
Click the image to enlarge
Past performance does not predict future returns. Source: MSCI, Bloomberg, HSBC am, September 2026.
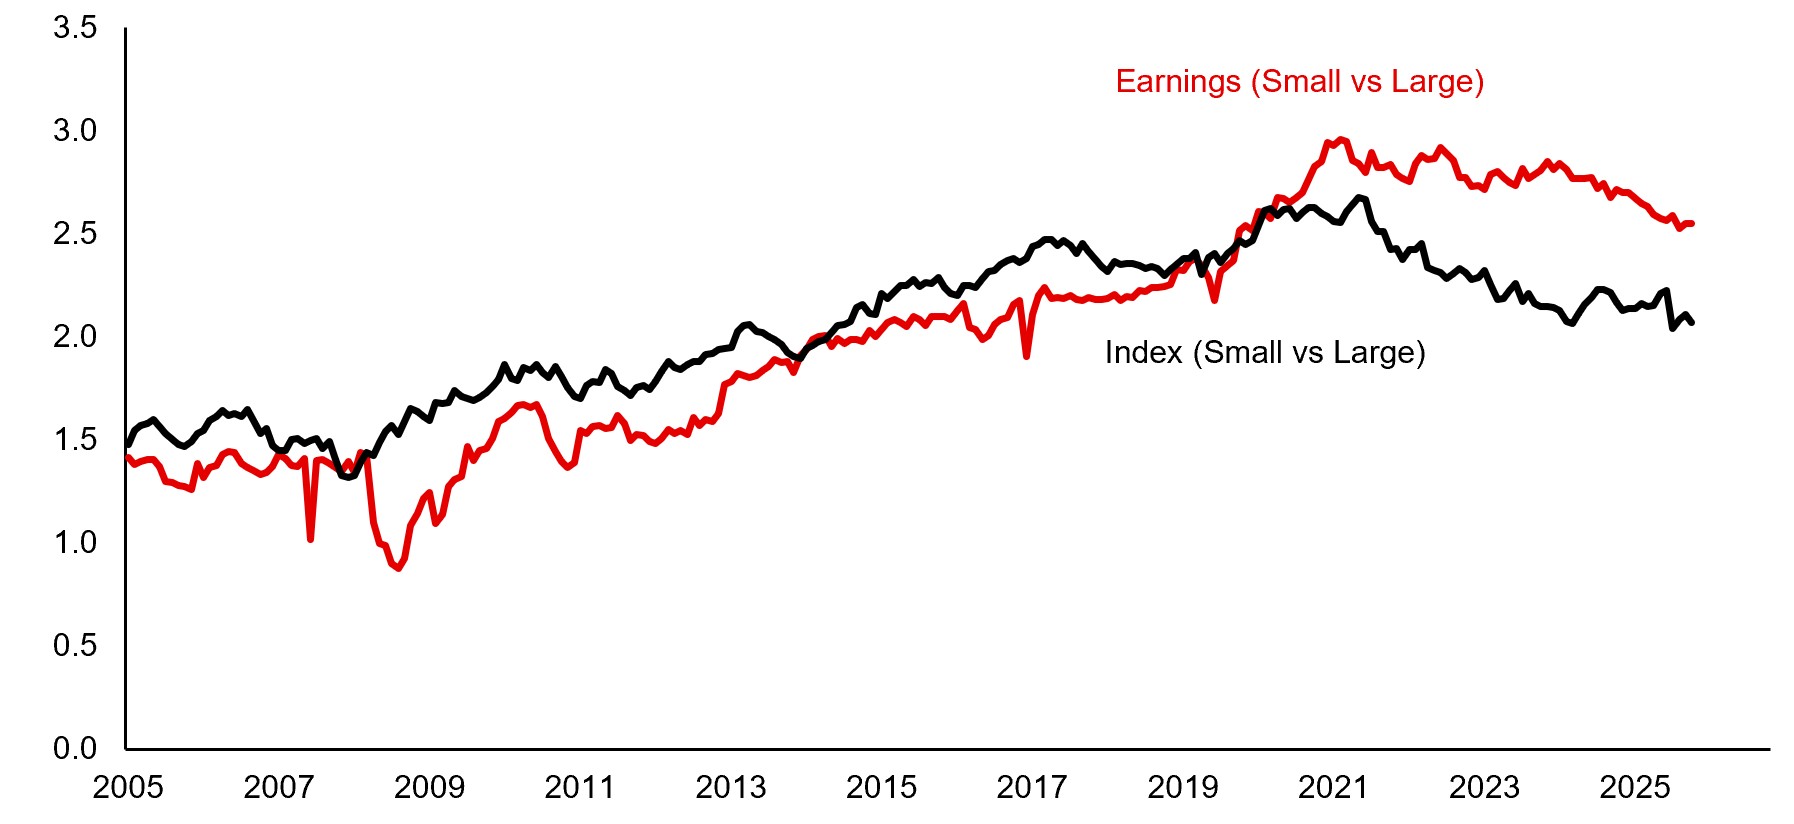
Small caps might appear to offer an obvious hedge because they contain fewer AI enablers. But their underperformance has not been caused by AI exposure alone. Weaker earnings, greater domestic sensitivity and higher exposure to interest rates have also mattered. Similarly, value strategies tend to own fewer AI winners, but also fewer companies most vulnerable to AI disruption. In both cases, stock selection has been more important than simply changing style exposure.
Figure 9: Small vs large cap
Click the image to enlarge
Source: HSBC AM, September 2026.
The attribution is revealing. In the European small cap universe, being underweight AI enablers accounted for around 300 basis points of relative performance drag. Yet even after separating that effect, domestic sensitivity, interest rates and weaker earnings remained relevant. Small caps can therefore reduce direct AI concentration without necessarily providing a clean hedge against an AI reversal.
A potentially more durable source of broadening lies with AI adopters. These are companies that can use the technology to lift productivity or reinforce an existing earnings story without relying on AI capex as their primary growth engine. European defence is one example. Earnings have been growing at around 20 per cent year-on-year in recent years, supported by higher defence budgets and a shift in spending towards equipment and technology. AI can enhance that investment case through greater automation and technology intensity, but it is one driver among several rather than the sole reason for owning the sector. Higher equipment intensity, stronger European procurement and operating leverage provide additional earnings drivers that are not dependent on the global semiconductor cycle.
Emerging markets offer another route. North Asia remains closely connected to semiconductor and AI infrastructure spending, but EM as a whole encompasses much broader structural forces. Demographic change, industrialisation, energy transition and financial inclusion create investment cycles driven more by domestic demand, reform and local capital formation than by global technology capex.
EM companies also occupy important positions across the energy transition value chain, from commodities to batteries, storage and electric vehicles. These earnings drivers are linked to physical investment, domestic development and local policy rather than simply the pace of global AI spending.
This distinction highlights that geographic broadening does not necessarily provide diversification if earnings remain tied to the same global AI capex cycle. Genuine broadening requires a wider range of underlying earnings drivers. The next phase of equity broadening is therefore unlikely to mean abandoning AI. It is more likely to involve widening the sources of return around it: retaining selective exposure to enablers where earnings justify valuations, while looking increasingly towards adopters, domestic growth stories and structural themes whose fortunes are driven by different parts of the global economy.
As earnings growth normalises and the valuation support narrows, distinguishing durable profits from those dependent on continued funding, favourable pricing or policy support should become increasingly important. The durability of the next equity cycle will depend less on the scale of AI related capex alone and more on whether AI adoption can generate sustained productivity gains while earnings growth broadens across sectors and markets.
Source: HSBC Asset Management, October 2026. Past performance does not predict future returns. The level of yield is not guaranteed and may rise or fall in the future. For informational purposes only and should not be construed as a recommendation to invest in the specific country, product, strategy, sector or security. The views expressed above were held at the time of preparation and are subject to change without notice. Any forecast, projection or target where provided is indicative only and not guaranteed in any way. HSBC Asset Management accepts no liability for any failure to meet such forecast, projection or target.
Important information
For Professional Clients and intermediaries within countries and territories set out below; and for Institutional Investors and Financial Advisors in the US. This document should not be distributed to or relied upon by Retail clients/investors.
The value of investments and the income from them can go down as well as up and investors may not get back the amount originally invested. The performance figures contained in this document relate to past performance, which should not be seen as an indication of future returns. Future returns will depend, inter alia, on market conditions, investment manager’s skill, risk level and fees. Where overseas investments are held the rate of currency exchange may cause the value of such investments to go down as well as up. Investments in emerging markets are by their nature higher risk and potentially more volatile than those inherent in some established markets. Economies in emerging markets generally are heavily dependent upon international trade and, accordingly, have been and may continue to be affected adversely by trade barriers, exchange controls, managed adjustments in relative currency values and other protectionist measures imposed or negotiated by the countries and territories with which they trade. These economies also have been and may continue to be affected adversely by economic conditions in the countries and territories in which they trade.
The contents of this document may not be reproduced or further distributed to any person or entity, whether in whole or in part, for any purpose. All non-authorised reproduction or use of this document will be the responsibility of the user and may lead to legal proceedings. The material contained in this document is for general information purposes only and does not constitute advice or a recommendation to buy or sell investments. Some of the statements contained in this document may be considered forward looking statements which provide current expectations or forecasts of future events. Such forward looking statements are not guarantees of future performance or events and involve risks and uncertainties. Actual results may differ materially from those described in such forward-looking statements as a result of various factors. We do not undertake any obligation to update the forward-looking statements contained herein, or to update the reasons why actual results could differ from those projected in the forward-looking statements. This document has no contractual value and is not by any means intended as a solicitation, nor a recommendation for the purchase or sale of any financial instrument in any jurisdiction in which such an offer is not lawful. The views and opinions expressed herein are those of HSBC Asset Management at the time of preparation and are subject to change at any time. These views may not necessarily indicate current portfolios' composition. Individual portfolios managed by HSBC Asset Management primarily reflect individual clients' objectives, risk preferences, time horizon, and market liquidity. Foreign and emerging markets: investments in foreign markets involve risks such as currency rate fluctuations, potential differences in accounting and taxation policies, as well as possible political, economic, and market risks. These risks are heightened for investments in emerging markets which are also subject to greater illiquidity and volatility than developed foreign markets. This commentary is for information purposes only. It is a marketing communication and does not constitute investment advice or a recommendation to any reader of this content to buy or sell investments nor should it be regarded as investment research. It has not been prepared in accordance with legal requirements designed to promote the independence of investment research and is not subject to any prohibition on dealing ahead of its dissemination. This document is not contractually binding nor are we required to provide this to you by any legislative provision.
All data from HSBC Asset Management unless otherwise specified. Any third-party information has been obtained from sources we believe to be reliable, but which we have not independently verified.
HSBC Asset Management is the brand name for the asset management business of HSBC Group, which includes the investment activities that may be provided through our local regulated entities. HSBC Asset Management is a group of companies in many countries and territories throughout the world that are engaged in investment advisory and fund management activities, which are ultimately owned by HSBC Holdings Plc. (HSBC Group).
- In Australia, this document is issued by HSBC Bank Australia Limited ABN 48 006 434 162, AFSL 232595, for HSBC Global Asset Management (Hong Kong) Limited ARBN 132 834 149 and HSBC Global Asset Management (UK) Limited ARBN 633 929 718. This document is for institutional investors only and is not available for distribution to retail clients (as defined under the Corporations Act). HSBC Global Asset Management (Hong Kong) Limited and HSBC Global Asset Management (UK) Limited are exempt from the requirement to hold an Australian financial services license under the Corporations Act in respect of the financial services they provide. HSBC Global Asset Management (Hong Kong) Limited is regulated by the Securities and Futures Commission of Hong Kong under the Hong Kong laws, which differ from Australian laws. HSBC Global Asset Management (UK) Limited is regulated by the Financial Conduct Authority of the United Kingdom and, for the avoidance of doubt, includes the Financial Services Authority of the United Kingdom as it was previously known before 1 April 2013, under the laws of the United Kingdom, which differ from Australian laws;
- In Bermuda, this document is issued by HSBC Global Asset Management (Bermuda) Limited, of 37 Front Street, Hamilton, Bermuda which is licensed to conduct investment business by the Bermuda Monetary Authority;
- In France, Belgium, Netherlands, Luxembourg, Portugal, Greece, Finland, Norway, Denmark, Spain and Sweden this document is issued by HSBC Global Asset Management (France), a Portfolio Management Company authorised by the French regulatory authority AMF (no. GP99026);
- In Germany, this document is issued by HSBC Global Asset Management (Deutschland) GmbH which is regulated by BaFin (German clients) respective by the Austrian Financial Market Supervision FMA (Austrian clients);
- In Hong Kong, this document is issued by HSBC Global Asset Management (Hong Kong) Limited, which is regulated by the Securities and Futures Commission. This content has not been reviewed by the Securities and Futures Commission;
- In India, this document is issued by HSBC Asset Management (India) Pvt Ltd. which is regulated by the Securities and Exchange Board of India;
- In Italy, this document is issued by HSBC Global Asset Management (France), a Portfolio Management Company authorised by the French regulatory authority AMF (no. GP99026), through its Italian branch, regulated by Banca d’Italia and Commissione Nazionale per le Società e la Borsa (Consob);
- In Japan, this document is issued by HSBC Asset Management (Japan) Ltd (JRN 3010001124868), regulated by the Financial Services Agengy;
- In Malta, this document is issued by HSBC Global Asset Management (Malta) Limited which is regulated and licensed to conduct Investment Services by the Malta Financial Services Authority under the Investment Services Act;
- In Mexico, this document is issued by HSBC Global Asset Management (Mexico), SA de CV, Sociedad Operadora de Fondos de Inversión, Grupo Financiero HSBC which is regulated by Comisión Nacional Bancaria y de Valores;
- In the United Arab Emirates, this document is issued by HSBC Investment Funds (Luxembourg) S.A. – Dubai Branch (Level 20, HSBC Tower, PO Box 66, Downtown Dubai, United Arab Emirates) regulated by the Capital Market Authority (CMA) in the UAE to conduct investment fund management, portfolios management, fund administration activities (CMA Category 2 license No.20200000336) and promotion activities (CMA Category 5 license No.20200000327).
- In the United Arab Emirates, this document is issued by HSBC Global Asset Management MENA, a unit within HSBC Bank Middle East Limited, U.A.E Branch, PO Box 66 Dubai, UAE, regulated by the Central Bank of the U.A.E. and the Capital Market Authority in the UAE under CMA license number 602004 for the purpose of this promotion and lead regulated by the Dubai Financial Services Authority. HSBC Bank Middle East Limited is a member of the HSBC Group and HSBC Global Asset Management MENA are marketing the relevant product only in a sub-distributing capacity on a principal-to-principal basis. HSBC Global Asset Management MENA may not be licensed under the laws of the recipient’s country of residence and therefore may not be subject to supervision of the local regulator in the recipient’s country of residence. One of more of the products and services of the manufacturer may not have been approved by or registered with the local regulator and the assets may be booked outside of the recipient’s country of residence.
- In Singapore, this document is issued by HSBC Global Asset Management (Singapore) Limited, which is regulated by the Monetary Authority of Singapore. The content in the document/video has not been reviewed by the Monetary Authority of Singapore;
- In Switzerland, this document is issued by HSBC Global Asset Management (Switzerland) AG. This document is intended for professional investor use only. For opting in and opting out according to FinSA, please refer to our website; if you wish to change your client categorization, please inform us. HSBC Global Asset Management (Switzerland) AG having its registered office at Gartenstrasse 26, PO Box, CH-8002 Zurich has a licence as an asset manager of collective investment schemes and as a representative of foreign collective investment schemes. Disputes regarding legal claims between the Client and HSBC Global Asset Management (Switzerland) AG can be settled by an ombudsman in mediation proceedings. HSBC Global Asset Management (Switzerland) AG is affiliated to the ombudsman FINOS having its registered address at Talstrasse 20, 8001 Zurich. There are general risks associated with financial instruments, please refer to the Swiss Banking Association (“SBA”) Brochure “Risks Involved in Trading in Financial Instruments”;
- In Taiwan, this document is issued by HSBC Global Asset Management (Taiwan) Limited which is regulated by the Financial Supervisory Commission R.O.C. (Taiwan);
- In Turkiye, this document is issued by HSBC Asset Management A.S. Turkiye (AMTU) which is regulated by Capital Markets Board of Turkiye. Any information here is not intended to distribute in any jurisdiction where AMTU does not have a right to. Any views here should not be perceived as investment advice, product/service offer and/or promise of income. Information given here might not be suitable for all investors and investors should be giving their own independent decisions. The investment information, comments and advice given herein are not part of investment advice activity. Investment advice services are provided by authorized institutions to persons and entities privately by considering their risk and return preferences, whereas the comments and advice included herein are of a general nature. Therefore, they may not fit your financial situation and risk and return preferences. For this reason, making an investment decision only by relying on the information given herein may not give rise to results that fit your expectations.
- In the UK, this document is issued by HSBC Global Asset Management (UK) Limited, which is authorised and regulated by the Financial Conduct Authority;
- In the US, this document is issued by HSBC Securities (USA) Inc., an HSBC broker dealer registered in the US with the Securities and Exchange Commission under the Securities Exchange Act of 1934. HSBC Securities (USA) Inc. is also a member of NYSE/FINRA/SIPC. HSBC Securities (USA) Inc. is not authorized by or registered with any other non-US regulatory authority. The contents of this document are confidential and may not be reproduced or further distributed to any person or entity, whether in whole or in part, for any purpose without prior written permission.
- In Chile, operations by HSBC's headquarters or other offices of this bank located abroad are not subject to Chilean inspections or regulations and are not covered by warranty of the Chilean state. Obtain information about the state guarantee to deposits at your bank or on www.cmfchile.cl;
- In Colombia, HSBC Bank USA NA has an authorized representative by the Superintendencia Financiera de Colombia (SFC) whereby its activities conform to the General Legal Financial System. SFC has not reviewed the information provided to the investor. This document is for the exclusive use of institutional investors in Colombia and is not for public distribution;
- In Costa Rica, the Fund and any other products or services referenced in this document are not registered with the Superintendencia General de Valores (“SUGEVAL”) and no regulator or government authority has reviewed this document, or the merits of the products and services referenced herein. This document is directed at and intended for institutional investors only.
- In Peru, HSBC Bank USA NA has an authorized representative by the Superintendencia de Banca y Seguros in Perú whereby its activities conform to the General Legal Financial System - Law No. 26702. Funds have not been registered before the Superintendencia del Mercado de Valores (SMV) and are being placed by means of a private offer. SMV has not reviewed the information provided to the investor. This document is for the exclusive use of institutional investors in Perú and is not for public distribution;
- In Uruguay, operations by HSBC's headquarters or other offices of this bank located abroad are not subject to Uruguayan inspections or regulations and are not covered by warranty of the Uruguayan state. Further information may be obtained about the state guarantee to deposits at your bank or on www.bcu.gub.uy.
Copyright © HSBC Global Asset Management Limited 2026. All rights reserved. No part of this publication may be reproduced, stored in a retrieval system, or transmitted, on any form or by any means, electronic, mechanical, photocopying, recording, or otherwise, without the prior written permission of HSBC Asset Management.
Content ID: D082460_V1.0; Expiry date: 30.09.2027.