Why Are Holidays More Expensive?
Executive Summary
If you’ve booked a holiday recently, you’ve probably noticed the price tag is a lot steeper than it used to be. In the UK, the average spend on a 7-day overseas holiday has jumped by 30 per cent since 2019—from GBP670 to GBP846 per person, outpacing general inflation. So, what’s going on? Let’s break down the reasons, the impact on travellers, and what this means for infrastructure investors.
The Price Surge: Setting the Scene
Have You Noticed?
The average Briton now spends GBP846 per person for an overseas trip, up from GBP670 in 2019, according to ONS data.
This increase is significant, especially as it outpaces broader inflation. Holidays, once a steadily more affordable luxury, are now a growing financial burden for many. Neither is this phenomenon limited to the UK, costs of vacations have been rising around the world.
Research by Aviva1 finds that the average person is spending almost GBP2,000 on a summer holiday, increasingly funded by cutting back on other discretionary purchases such as nights out, restaurant dinners and other leisure outings through the year.
People do this because holidays are important. Traditionally viewed as a luxury… then as a nice treat… and now as an annual staple, the summer holiday is a non-negotiable for many households.
Why Are Holidays More Expensive?
There are two major components to the cost of a holiday;
- Flights
- Hotels/accommodation
Like many industries through the global pandemic, supply chain constraints hit aviation and the hotel industry; except that the aftereffects are still being felt in these two industries long after our supermarket shelves have returned to normal.
Supply Constraints in Air Travel
Aircraft Manufacturing Bottlenecks
Demand for holidays increases at a touch above the rate of global population growth. This is because (1) people migrate from lower to middle income, and (2) non-working (retired) population increases more quickly than the working age population.
To satisfy this demand, transport capacity needs to grow. For those who wish to travel overseas, an increasing number of aircraft are required.
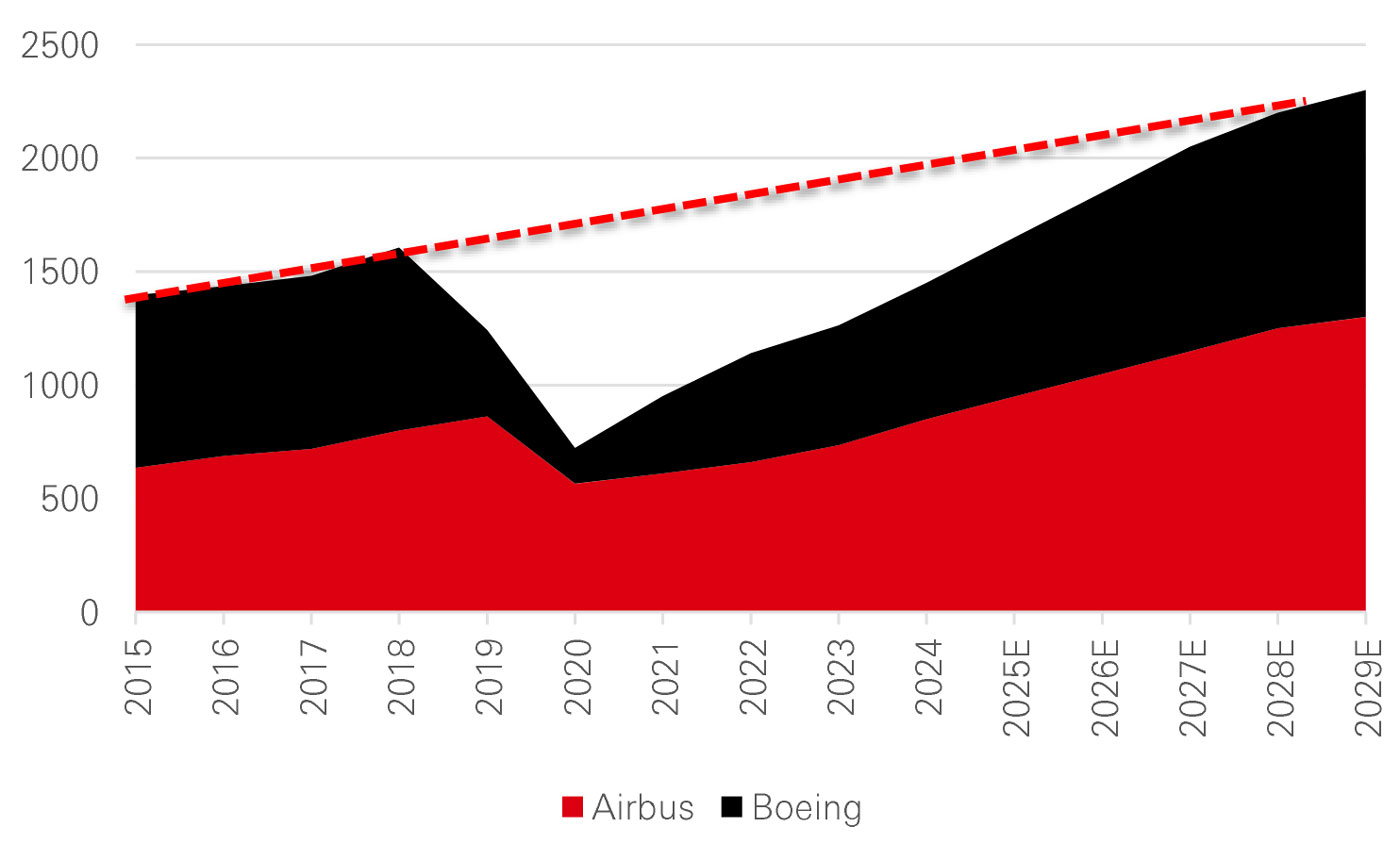
Boeing and Airbus are the main manufacturers of aircraft globally. They have both experienced supply chain challenges, resulting in production rates lagging their full potential. In 2018 these two companies produced approximately 1,500 aircraft, a level which has not yet recovered. Although 2026 looks promisingly close to hitting the previous high watermark, the 6-year period of ‘undersupply’ is unlikely to ever be recovered.
Combined Boeing + Airbus production
Click the image to enlarge
Source: Company data, December 2025
Furthermore, issues with components installed in existing aircraft has necessitated a temporary grounding of a substantial portion of the short haul aircraft in operation.
The natural rate of demand (i.e. GDP growth) has fully recovered, but the market is now structurally undersupplied. Going forward, incremental demand will likely be satisfied by incremental supply, but the market adjustment over the past few years is likely to remain, in our view.
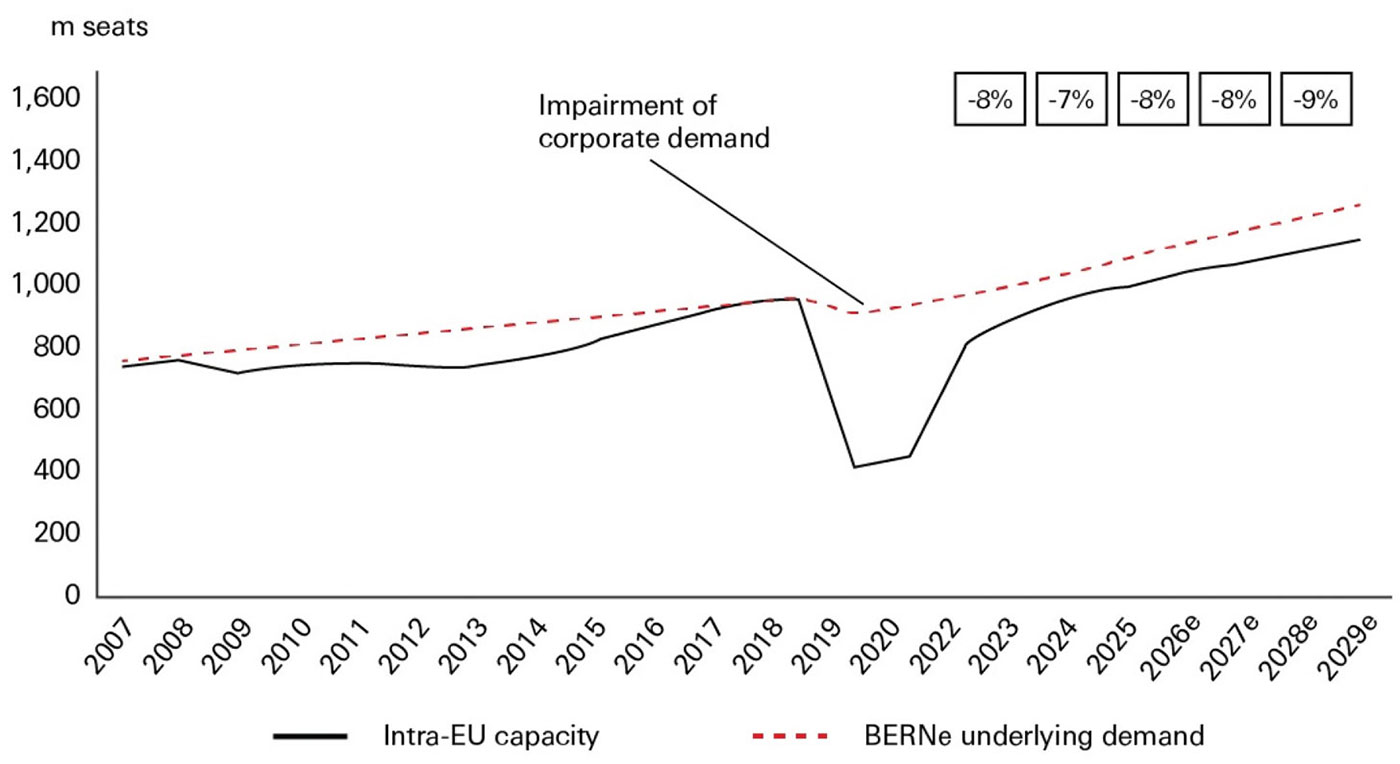
Intra-European aviation is set to remain structurally undersupplied
Click the image to enlarge
Source: SRS, Company reports, Bernstein estimates and analysis, December 2025
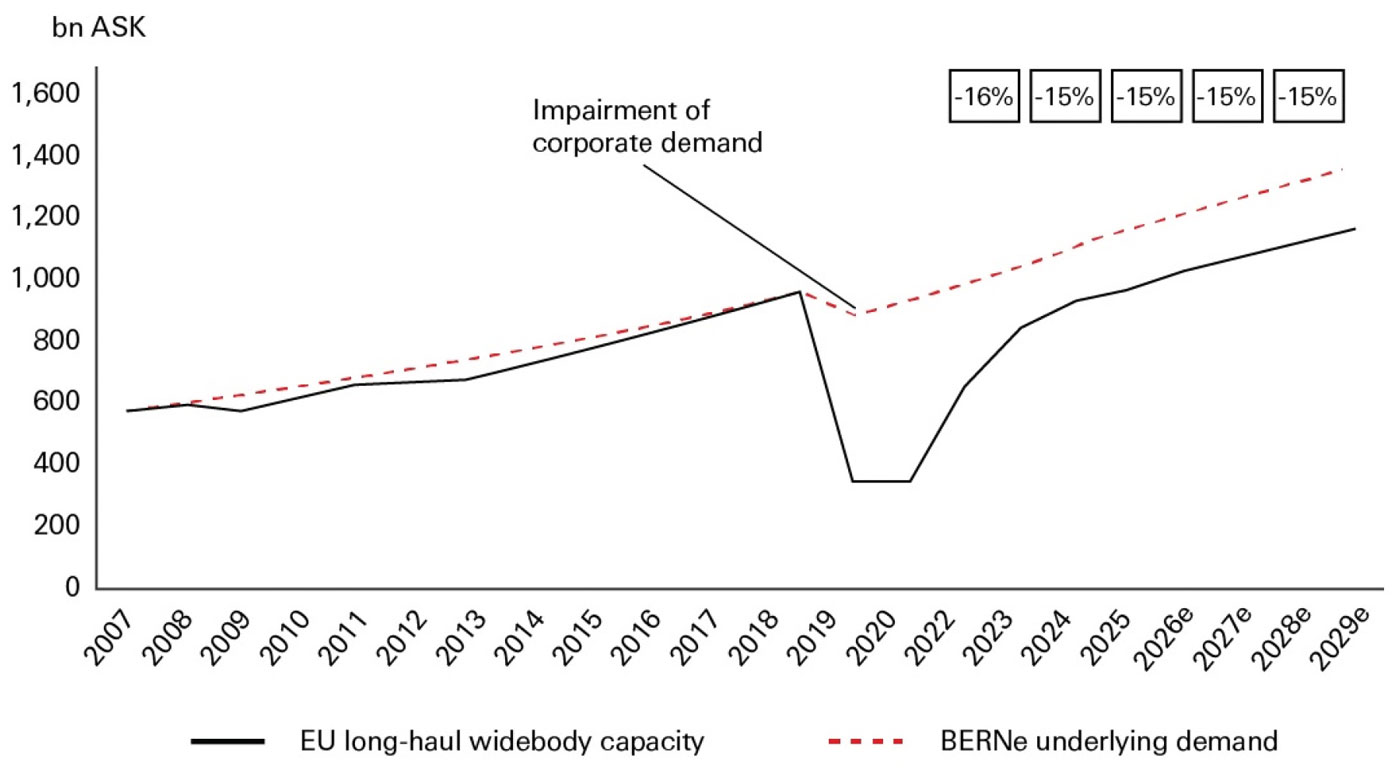
European widebody long-haul capacity is set to continue undershooting structural demand
Click the image to enlarge
Demand-supply gap indicated in the rectangles
Source: SRS, Company reports, Bernstein estimates and analysis, December 2025
Downsizing in constrained airports
A further constraint in the aviation system is airport capacity and the evolution of long haul aircraft. There are very few places in the world which benefit from plentiful airport capacity.
In Europe, the majority of airports are considered ‘slot constrained’, meaning there are complex procedures and incentives determining what airlines do with the slots at their disposal.
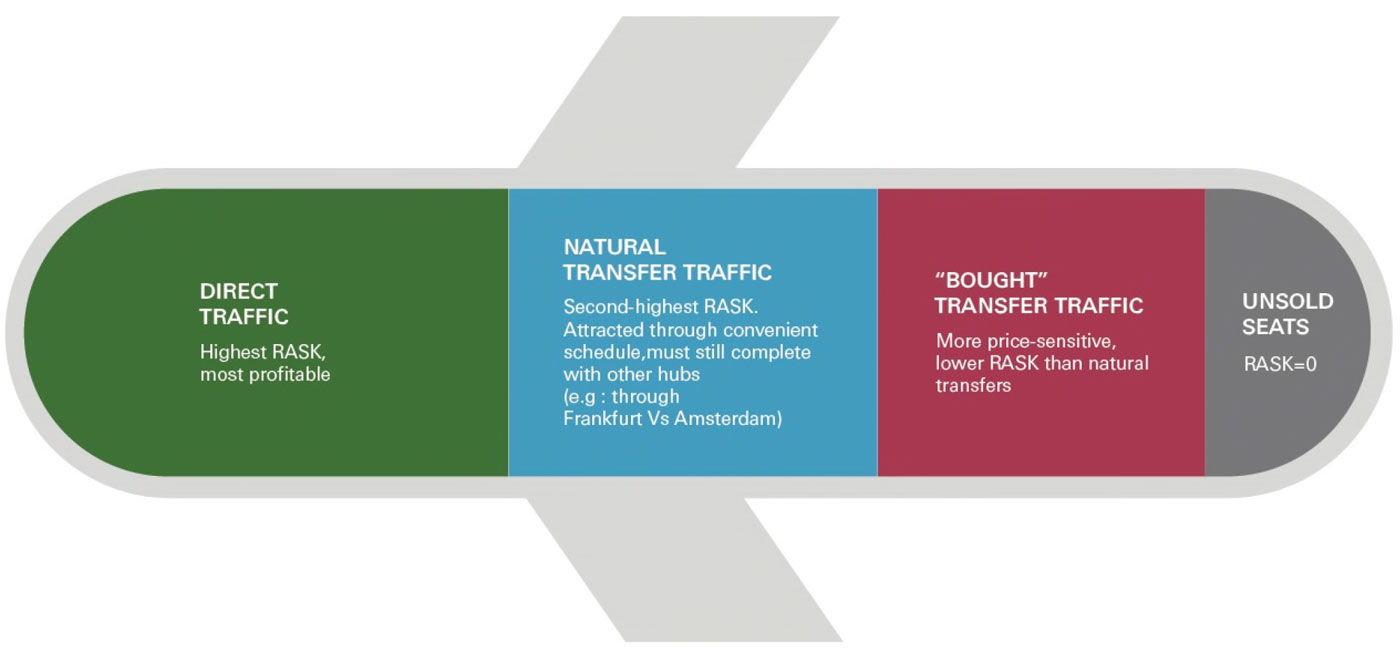
In the not so distant past, conventional wisdom dictated that airlines operating in slot constrained airports should acquire larger aircraft in order to grow their revenues. The problem with this strategy is that there is a sweet spot, beyond which airlines need to discount ticket prices to fill seats; good for fliers, not for the bottom line.
Direct traffic is more profitable than transfer traffic; higher RASK2, and lower operating cost from connecting passengers and intervening in missed connections.
Click the image to enlarge
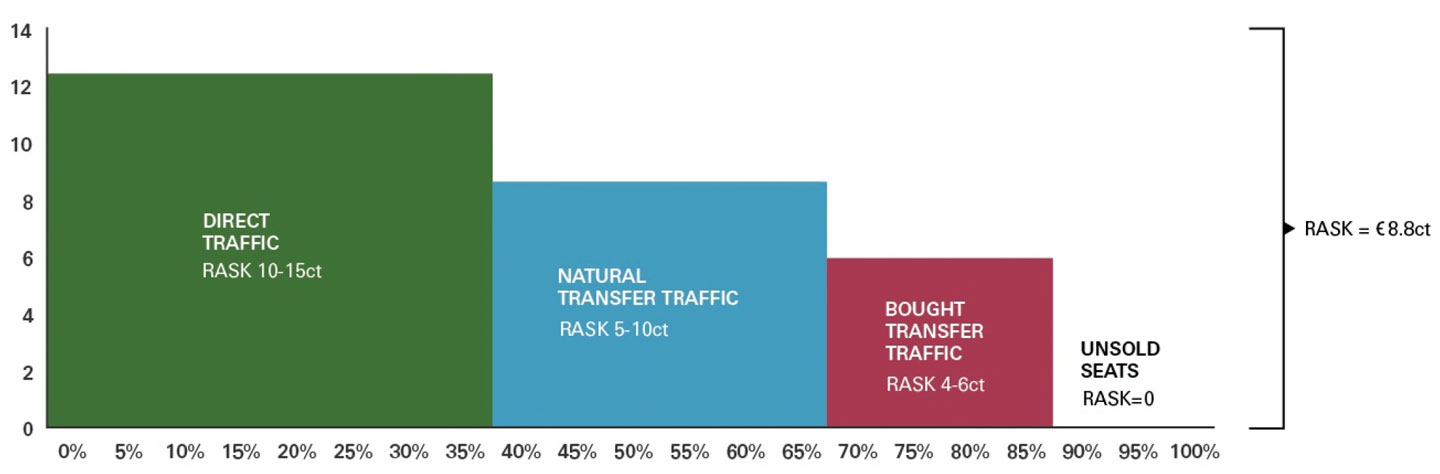
Click the image to enlarge
Source: Bernstein analysis
Numbers illustrative
A response to this has been to shift to smaller planes, which are more fuel efficient, with lower breakeven load factors… but able to command higher yields. By using smaller planes, airlines can offer flights to smaller and more varied destinations, without having to fill a portion of the seats with transfer traffic (see previous chart as an illustration of the pitfalls of overreliance on transfer traffic). Importantly these smaller planes still occupy one slot, so they do not free up space for new competitors to enter.
This trend is highlighted by evolution of the European widebody fleet below, showing the growing reliance on Boeing’s 787 and Airbus’ A350 – aircraft which buck the trend of scale economics, carrying 25-45 per cent fewer passengers than the Boeing 747 and Airbus A380, but with considerably lower running costs.
European widebody capacity has moved away from the 747 and the A340 in favor of the A350 and 787
Total European intercontinental widebody capacity share, ASK
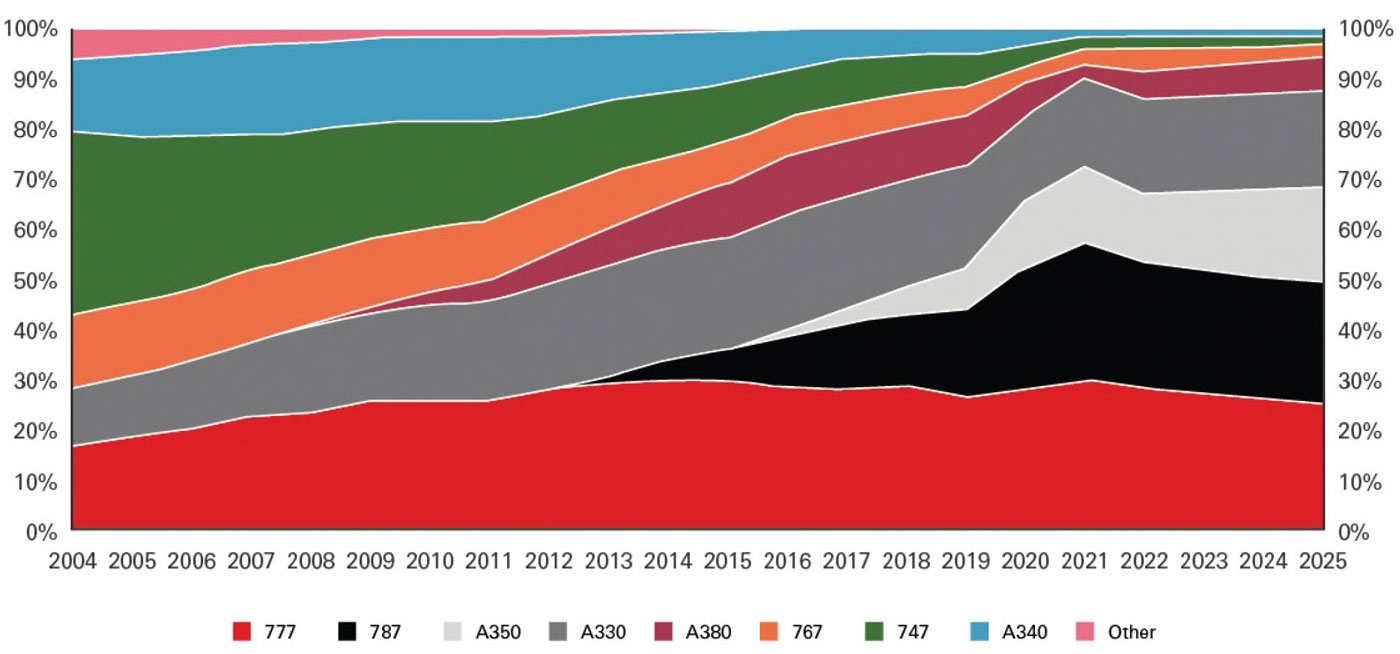
Click the image to enlarge
Source: SRS, Bernstein analysis
Note: ASK = Available Seat Kilometre
The goal of this refined strategy for long haul flying is to maximise the proportion of seats filled by direct traffic, that is, travellers who are flying directly between A and B, rather than transfer traffic, which is flying A to B in order to reach C.
For consumers, this means flights between Europe and the Americas are likely to continue to remain expensive. Flights with proximity to the Middle East, where the transfer traffic model remains intact, may not see the same degree of permanence to unexpectedly high prices.
For infrastructure investors, the type of plane on which a passenger flies is broadly irrelevant, but not to the extent which demand is stifled by prices. There is no evidence that this is occurring, but it is a factor we pay close attention to. It is important for airports and legislators to continue to support capacity expansion and foster competitive tension between airlines, given the importance of aviation to economic development.
The Cost of Emissions
In 2023 the EU adopted the ReFuelEU regulation. This is part of the “Fit for 55” package, aiming to reduce aviation emissions by 55 per cent by 2030.
This package contained a range of measures relating to the adoption of Sustainable Aviation Fuel (SAF), in addition to procedural changes on where airlines can purchase aviation fuel.
In addition to this, the EU Emissions Trading System as applied to airlines has resulted in a rapid scaling back of the ‘free’ emissions certificates awarded to airlines. These were scaled back by 25 per cent in 2024, 50 per cent in 2025 and by 100 per cent in 2026.
This means that, from 2026, all CO2 emissions for intra-Europe flights are ‘paid for’ at market prices. The market price of these emissions has risen nearly fivefold since 2019, which means that the total compliance cost for the largest European airlines will likely rise from less than EUR500m in 2019, to above EUR4bn from 2026; taking the total fuel bill some 30 per cent higher compared to 2019, in spite of the price of oil being moderately lower today than it was five years ago.
The total ETS bill for our coverage is set to rise from c.€0.5bn to around €4.0bn
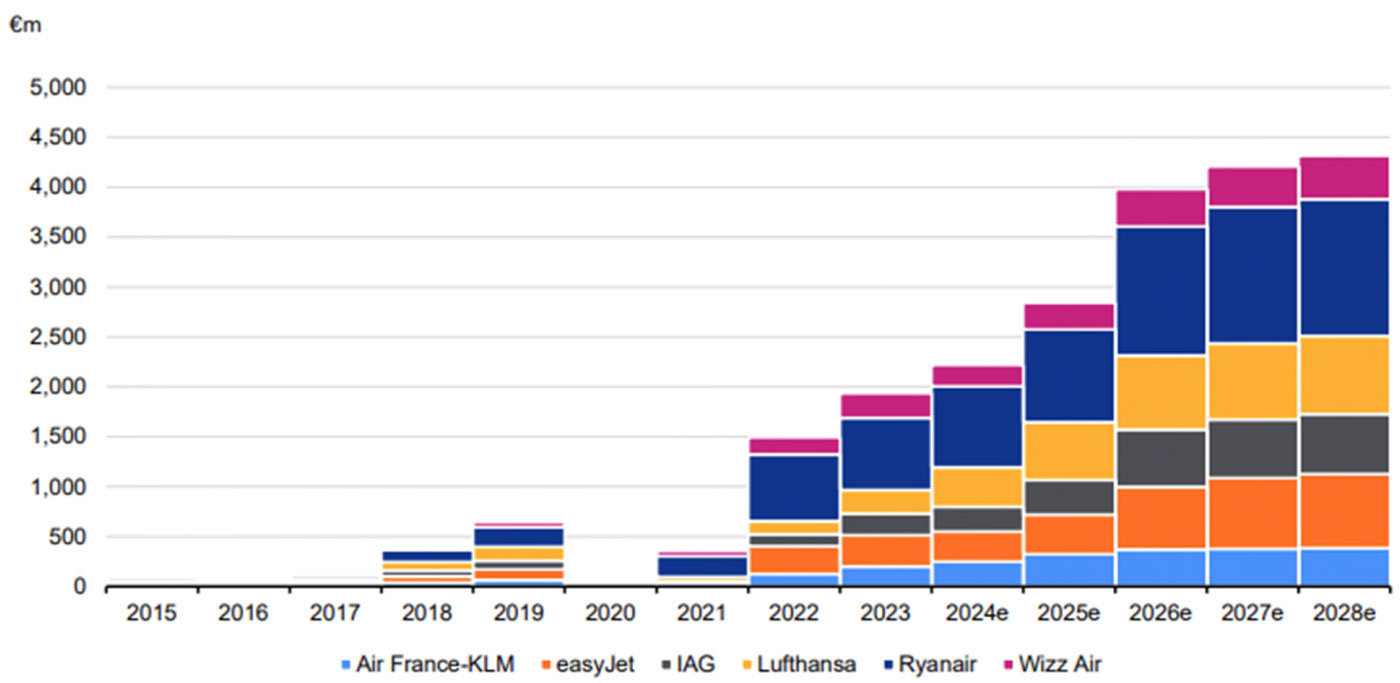
Click the image to enlarge
Intra-European aviation across our coverage
Source: Company reports, Bernstein estimates and analysis, December 2025
While these additional compliance costs are most acute in Europe, SAF mandates are becoming more widespread. While the impact on emissions reduction is likely to be large in the long run; airlines and consumers notice the costs much more quickly in the short run, given it costs more than double the price of regular jet fuel.
Fuel is one of the largest costs for airlines, and one which is impossible to have a differentiated strategy on (all airlines fly similar aircraft and burn identical fuel). This is therefore likely to end up being passed-on to users, in spite of this being a highly competitive industry.
Infrastructure investors can have a direct impact in this area by either carrot or stick.
It is becoming more common for airports to differentiate landing charges by the emissions profile of the aircraft. This provides a strong incentive for airlines to fly newer and more fuel efficient aircraft.
Airports can also reduce some of the frictions in the sustainable aviation fuels (SAF) market by providing onsite fuel farm facilities, working with producers to ensure scale advantages are secured, and by advocating for ‘book and claim’ rules to accelerate adoption.
Finally, a non-negligible amount of aircraft emissions arise from taxiing on runways and from inefficient routings. In our view, there is a clear opportunity for the airport, ground handling and air traffic control industries to work together to remove systematic inefficiencies and offer technologies to avoid having engines running while aircraft sit idle.
These compliance cost headwinds are most acutely felt within the confines of the EU; for flights and airports outside the region, there remains a likelihood that reductions in fuel prices result in lower ticket prices; and a resumption of stronger growth rates for airports.
Geopolitical Tensions and Airspace Closures
With geopolitical tensions higher than in recent memory, the human consequences are being felt on the ground in Eastern Europe and the Middle East. A combination of ballistic activity and sanctions have resulted in a patchwork of airspace restrictions hampering airlines from flying the shortest and quickest route between Asia and Europe.
The unavailability of Russian airspace, in particular, presents an acute challenge to airlines. The great circle route between Europe and large parts of North Asia travels over Russian airspace. Re-routing to the south to avoid this is resulting in additional flying time of up to 3 hours.
Not only is this inconvenient for the traveller, it also results in additional fuel burn, and in extremis, requires an additional aircraft to operate the same schedule. This burdens the airline with additional costs, which as already alluded, are being passed on to consumers through higher ticket prices.
The Middle East region is also a heavily transited airspace, marked by on-off closures over the past two years. Pakistan’s airspace is closed for Indian airlines (i.e. cutting off the most logical route to Europe). Corridors within European airspace have also faced on-off restrictions for Military Aircraft to/from Ukraine and nearby bases. All of this introduces planning challenges, airspace management inefficiency, delay, additional fuel burn…. And additional costs for airlines.
While the most visible impact of recent conflicts for many consumers has been energy prices; there are ongoing effects up in the skies.
For airport investors, this has not affected airports equally. Northern European airports have seen a more challenging operating environment than Southern Europe. Bulgaria & Turkiye’s airports have also suffered a reduction in tourists from both Ukraine and Russia.
From an investment perspective we think it is important to acknowledge this situation is not likely to be permanent, and traffic flows may one day change. It is beyond our expertise to suggest when, however we see investment opportunities which do not need this situation to resolve, but would serve as a helpful upside kicker if we revert to a more efficient airspace setup.
Hotel Supply Constraints
Switching focus to the second area of expense in a holiday – accommodation. Prices have risen, for reasons that may be more straightforward to explain, but no less structural.
Hotel Room Supply Slows to a Crawl
First of all, the hotel construction pipeline is relatively slim, and we have been through a period where relatively little new supply was added.
In the five years to 2020, hotel room growth was in the region of 2-3 per cent p.a. across key vacation markets; whereas since 2020, this figure has broadly halved.
As has been previously mentioned, demand for vacations has continued to rise, but has undershot GDP in the past five years.
Hotel Room Stock vs. GDP Growth in the 5years pre/post COVID
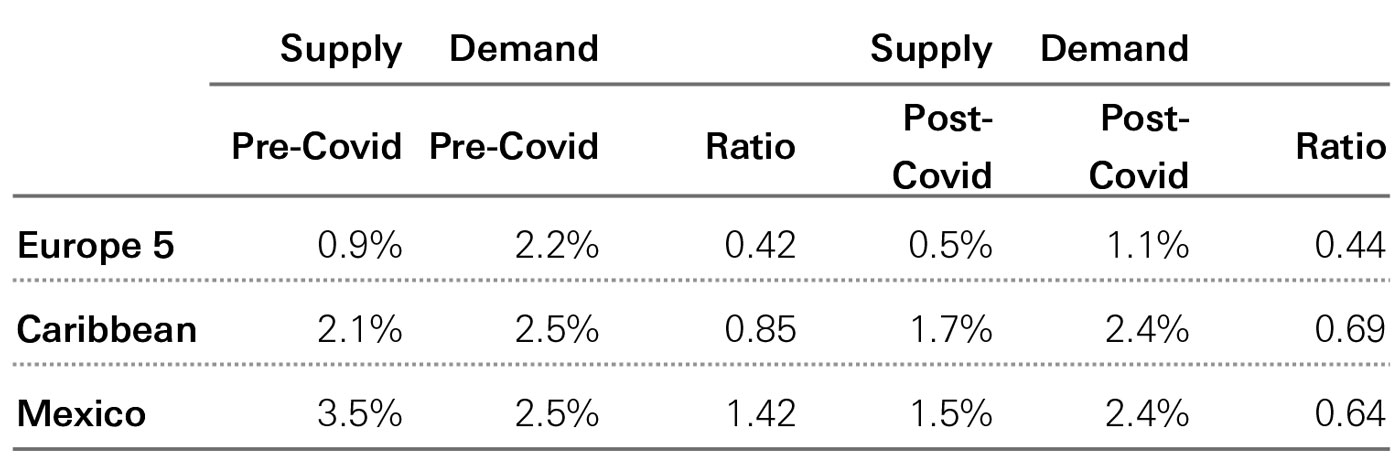
Click the image to enlarge
Europe 5: Spain, Italy, France, Greece, Portugal
Source: HSBC estimates based on company data, Bloomberg, December 2025
Similar to the under-production of aircraft in the past five years, it seems unlikely that hotel supply will ‘catch up’, considering both construction cost and financing cost (interest rates) have moved much higher.
The Slowing “AirBnB Effect”
Further complicating the picture on supply vs. demand for accommodation is the “AirBnB effect”; which has the effect of creating additional supply in many markets around the world as homeowners make their apartments/homes/annexes rentable. Although this capacity is now a large portion of most accommodation markets, incremental growth has been virtually zero across the five most popular vacation destinations in Europe (Spain, Italy, France, Greece and Portugal).
Hotel Operating Costs on the Rise
Hotel operating costs can be distilled down to;
- Labour (front of house, restaurant, cleaning)
- Energy (heating and cooling rooms)
- Soft product (food offering, bars & restaurants)
All of these categories have seen significant cost inflation, which need to be covered by hotel guests. While hotel chains have sought to adapt and amend business models and product offerings to mitigate cost pressures, we perceive that with higher prices, guests have an expectation of better service, which constrains the ability of hotel operators to reduce costs aggressively.
Higher prices here to stay
For the best part of 50 years, vacations were on a downward cost curve. Greater affordability, accessibility, and a shifting preference to acquire ‘experiences’ vs. goods meant consumers were able to continuously expand their horizons at a shrinking portion of disposable income.
Aviation and hospitality remain some of the most competitive and dynamic industries out there, and so we would not rule out an eventual return to moderate price deflation, but the adjustment we faced over the past few years is here to stay.
Consumers will likely benefit from booking early, being flexible with dates, willing to try new destinations – things that were always available to the budget conscious traveller, but perhaps more important now.
For investors involved in the tourism value chain, there are multiple considerations. We believe exposure to destinations with enduring appeal should anchor portfolio exposure in airports. Supplementing this now with ‘value’ destinations (high volume, low price) and high income origination points should help mitigate the risk of exposure to affordability concerns and price elasticity.
Our listed infrastructure equity process seeks to identify the assets best exposed to these longer term considerations through a robust quality scoring process. We remain attuned to inflection points in aircraft supply and geopolitical shifts, while remaining mindful of overly ambitious investment/capacity expansion as the demand cycle transitions away from “spending excess savings” to an environment where travel expenditure needs to be sustainably calibrated to disposable incomes.
1) Source Aviva, July 2024
2) RASK = Revenue per Available Seat Kilometre, a measure of airline ticket price
The views expressed above were held at the time of preparation and are subject to change without notice. Any forecast, projection or target where provided is indicative only and is not guaranteed in any way. HSBC Asset Management accepts no liability for any failure to meet such forecast, projection or target. Past performance does not predict future returns.
Important Information
For Professional Clients only and should not be distributed to or relied upon by Retail Clients.
Issued and approved in the UK by HSBC Global Asset Management (UK) Limited (“AMEU”), which is authorised and regulated by the Financial Conduct Authority. HSBC Asset Management is a group of companies in many countries and territories throughout the world that are engaged in investment advisory and fund management activities, which are ultimately owned by HSBC Holdings Plc. HSBC Asset Management is the brand name for the asset management business of the HSBC Group.
The material contained herein is for marketing purposes and is for your information only. This document is not contractually binding nor are we required to provide this to you by any legislative provision. It does not constitute legal, tax or investment advice or a recommendation to any reader of this material to buy or sell investments. You must not, therefore, rely on the content of this document when making any investment decisions. This document is not intended for distribution to or use by any person or entity in any jurisdiction or country where such distribution or use would be contrary to law or regulation. This document is not and should not be construed as an offer to sell or the solicitation of an offer to purchase or subscribe to any investment. The contents are confidential and may not be reproduced or further distributed to any person or entity, whether in whole or in part, for any purpose. This document is intended for discussion only and shall not be capable of creating any contractual or other legal obligations on the part of AMEU or any other HSBC Group company. This document is based on information obtained from sources believed to be reliable, but which have not been independently verified. AMEU and HSBC Group accept no responsibility as to its accuracy or completeness. Care has been taken to ensure the accuracy of this presentation, but AMEU accepts no responsibility for any errors or omissions contained therein.
This document and any issues or disputes arising out of or in connection with it (whether such disputes are contractual or non-contractual in nature, such as claims in tort, for breach of statute or regulation or otherwise) shall be governed by and construed in accordance with English law.
Any views expressed were held at the time of preparation and are subject to change without notice. While any forecast, projection or target where provided is indicative only and not guaranteed in any way. AMEU accepts no liability for any failure to meet such forecast, projection, or target. The value of investments and any income from them can go down as well as up and investors may not get back the amount originally invested. Any performance information shown refers to the past and should not be seen as an indication of future returns.
Recipients of this communication who intend to acquire an investment in a Fund are reminded that any such acquisition may only be made on the basis of the final form of the Offering Memorandum or Prospectus, fund legal documentation, and on satisfaction of the requirements of the applicable Subscription Document. It is the responsibility of prospective investors to satisfy themselves as to full compliance with the relevant laws and regulations of any territory in connection with any application to participate in the Fund.
Detailed information for article 8 and 9 sustainable investment products, as categorised under the Sustainable Finance Disclosure Regulation (SFDR), including; description of the environmental or social characteristics or the sustainable investment objective; methodologies used to assess, measure and monitor the environmental or social characteristics and the impact of the selected sustainable investments and; objectives and benchmark information, can be found at: https://www.assetmanagement.hsbc.co.uk/en/institutional-investor/investment-expertise/sustainable-investments/sustainable-investment-product-offering
To help improve our service and in the interests of security we may record and/or monitor your communication with us. AMEU provides information to Institutions, Professional Advisers and their clients on the investment products and services of the HSBC Group.
www.assetmanagement.hsbc.co.uk
Copyright © HSBC Global Asset Management (UK) Limited 2026. All rights reserved.
Content ID: D065972_v1.0 ; Expiry Date: 01.02.2027