
Macro Insight
Surge in IPOs
More mega cap and smaller IPOs are forecast for 2026. Participation is broadening out beyond innovative US mega-cap companies and into emerging markets with China also getting involved. The valuations of IPO companies are now in the trillions, not the billions seen in 2000. IPOs bring exciting and innovative businesses to public markets. But in a sea of enthusiasm investors can feel pulled in by the opportunity set and, in many cases, the fear of missing out. We caution against being tempted into unforgiving entry points where valuations look stretched versus fundamentals. Selective bottom-up stock picking and diversified portfolios can help hedge overly concentrated bets.
We look back at the two recent IPO surges. Today’s Tech ecosystem is generating far more profit than in the 1990s. But in every cycle while some IPO candidates will have profitability at the heart of their investment case, many won’t. In addition, the 2000 bubble wasn’t entirely without profits. There was a burst in Tech EPS growth versus the wider market, with companies like Nokia and Ericsson profiting hugely in the late 1990s as the purchase of telecoms kit and cables surged. But those profits did not last forever, as shown below. To shed some light on IPO cycles, we focus on 4 themes: (1) profits, 2) sentiment and the anatomy of a bubble, 3) IPO history, and 4) re-equitisation (more share issuance).
Theme 1: Profits
2000 bubble
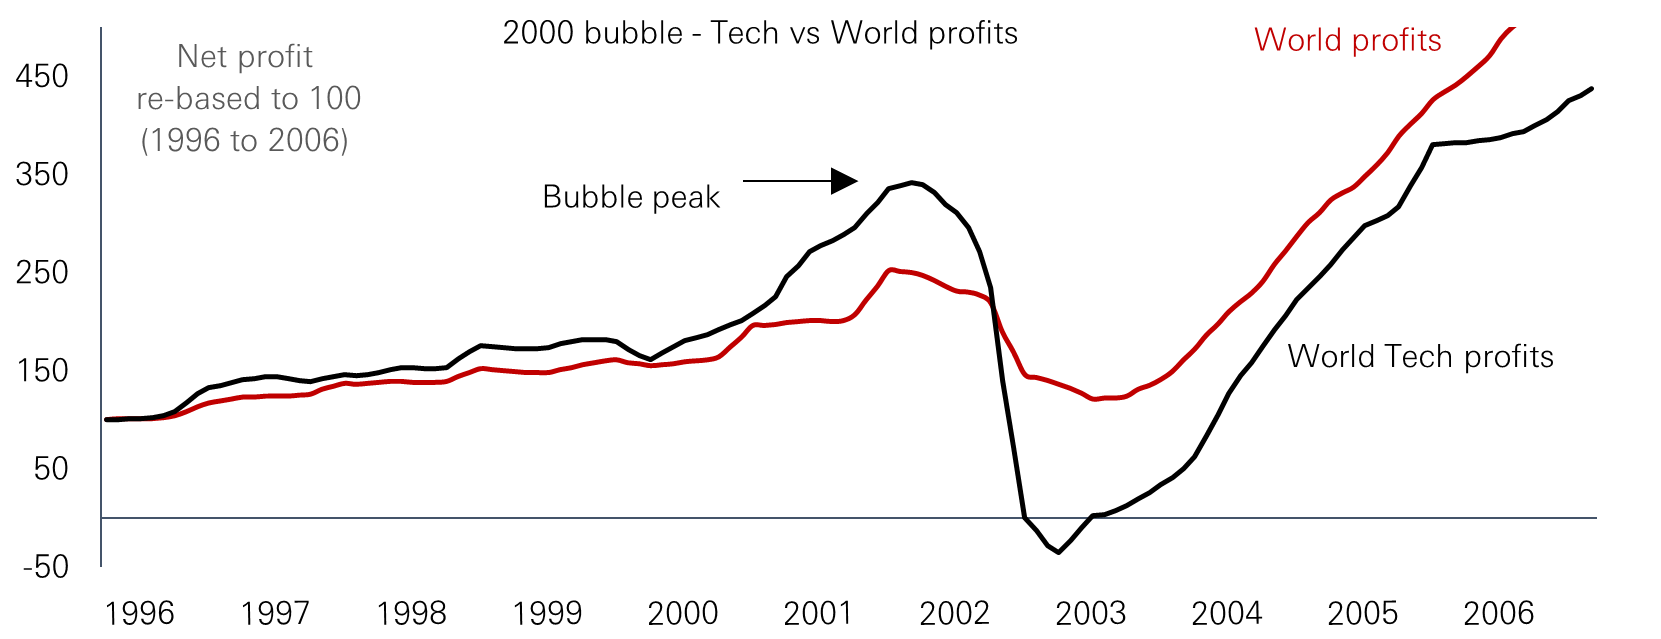
Even in the supposedly profitless dot.com bubble of the late 90s/early noughties, tech profits soared relative to the market. Figure 1 shows that reported (trailing) profits were still rising to end-2001 but shortly thereafter rolled over. It took about six years to get back to 2001 levels.
Figure 1: 2000 Bubble - Global Tech profits before and after
Click image to enlarge
Source: Refinitiv, DataStream (all country world), trailing net profits, HSBC Asset Management, June 2026
Current cycle
Today’s profit cycle is one of the strongest on record, dwarfing the 2000 cycle. While profit growth is going strong, we are conscious that it looks frothy on any comparison with history.
Figure 2: Current cycle - Global Tech profits roaring past wider market
Click image to enlarge
Source: Refinitiv, DataStream (all countries world), Trailing net profits, HSBC Asset Management, June 2026
Profit margins
We also need to consider the longevity of profit margins from here. US Tech’s net profit margin is close to 27 per cent today (as last reported). This is double 2000 levels and triple the longer-run average of 11 per cent for Global tech (from 1980 to date).
Figure 3: Profit margins (per cent) are double 2000 peak
Click image to enlarge
Source: Refinitiv, Data-Stream (all countries world), HSBC Asset Management, June 2026
Profit growth fuels confidence
The visibility of today’s profits is helping to fuel investor enthusiasm, with US Tech and Communication Services making up c. 65 per cent of US 2026e profit growth. This has risen exponentially for EM AI plays too. These Tech margins are more about mammoth capex spend, with 40-45 per cent of it circling back into the wider Tech sector. Bottlenecks in the data-centre build-out are driving hyper scalers’ costs (and suppliers’ margins) even higher. Korea and Taiwan benefit, with memory chip prices up four-fold since September 2025. Plus, Nvidia’s latest results flagged that 92 per cent of its Q1 revenues were from datacentres. In summary, this momentous capex is a key part of investor confidence.
Theme 2: Sentiment cycles
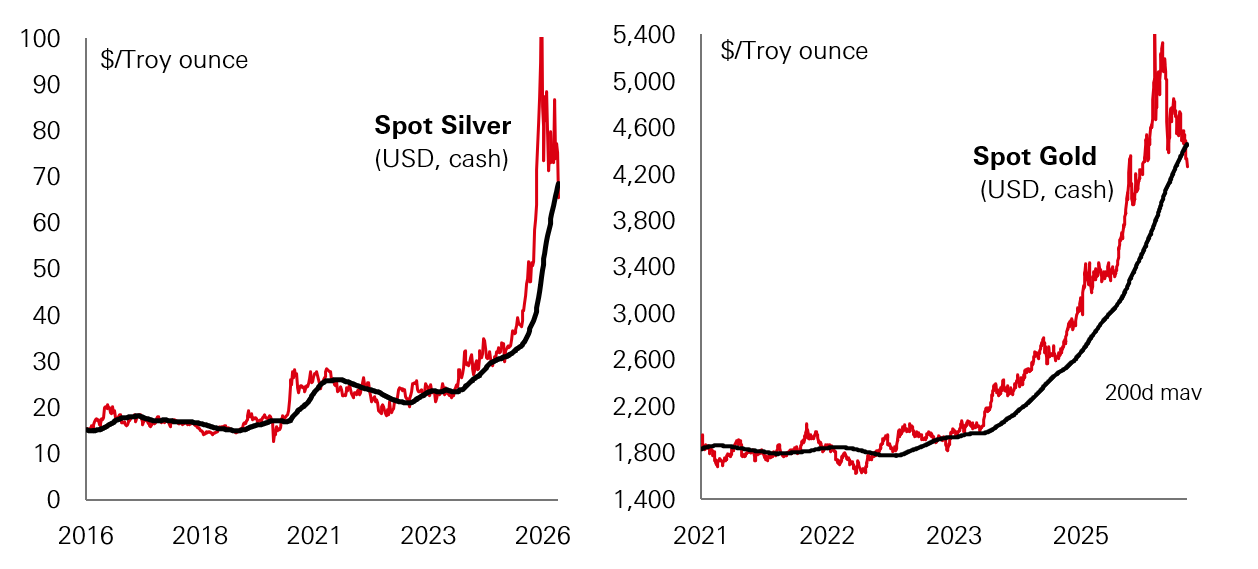
Behavioural finance highlights how easily markets can drift away from fundamentals. The “Greater Fool” dynamic describes investors buying simply because prices are rising, assuming someone else is waiting to pay more. Keynes’ “beauty contest” analogy captures a similar idea: investors try to anticipate what others will favour, rather than what is intrinsically attractive. Recent episodes of social-media-driven moves — such as the sudden surge in silver on scarcity narratives — show how quickly speculation can take hold. However, the chart shows that these momentum plays have limits. Both gold and silver suffered profit taking after prices flew past their 200-day moving average. Investors ned to calibrate return expectations carefully to avoid disappointment.
Figure 4: Speculative trading - silver and gold collapsed back to 200 day moving average
Click image to enlarge
Source: Refinitiv, HSBC Asset Management, June 2026
5 stages of a typical bubble
Again, we make no judgement about what stage we are currently in. Instead, we highlight the more typical phases of an equity bubble to provide perspective. Every cycle is different but generally transformative technology drives the fear of missing out (FOMO) and a capex cycle that can last for many years. Today AI related capex forecasts are still rising, but we keep a watchful eye on them.
Charles Kindleberger’s classic framework from Manias, Panics and Crashes outlines five stages of a bubble as shown below. We see some similarities within the current cycle
- Exogenous shock - Agentic AI (crowds out other investment)
- Credit creation – New often private funding rises to support a jump in capex (and FOMO)
- Euphoria – High profits and rising expectations drive speculative flows and concentration
- Insiders sell – Hallmark of 2000 tech bubble was insider selling (lock-up expiries/1999/2000)
- The bust – Revulsion, the last bull goes home
Theme 3: IPO cycles
Not every transformative cycle ends the same way. Often the technology survives, but some companies don’t. The late 1990s combined the PC boom with the rapid expansion of the web, which demanded huge investment in high-speed infrastructure. The telecom’s operators (like Nokia and Ericsson) benefited from soaring demand for telecom equipment, but by 2000 the cost of 3G licences pushed telecom operators’ debt to unsustainable levels. The telecom equipment companies offered vendor financing to keep sales growing. Ultimately, a spending binge led to excess capacity which drove bandwidth prices down by roughly 90 per cent post 2000. Following this, a major US infrastructure player collapsed into one of the largest US bankruptcies at the time (2002). While this is not the norm and we are not suggesting this will repeat itself, the lesson is familiar: in some cases, prices can rise far faster than the underlying economics can support.
2000 IPOs
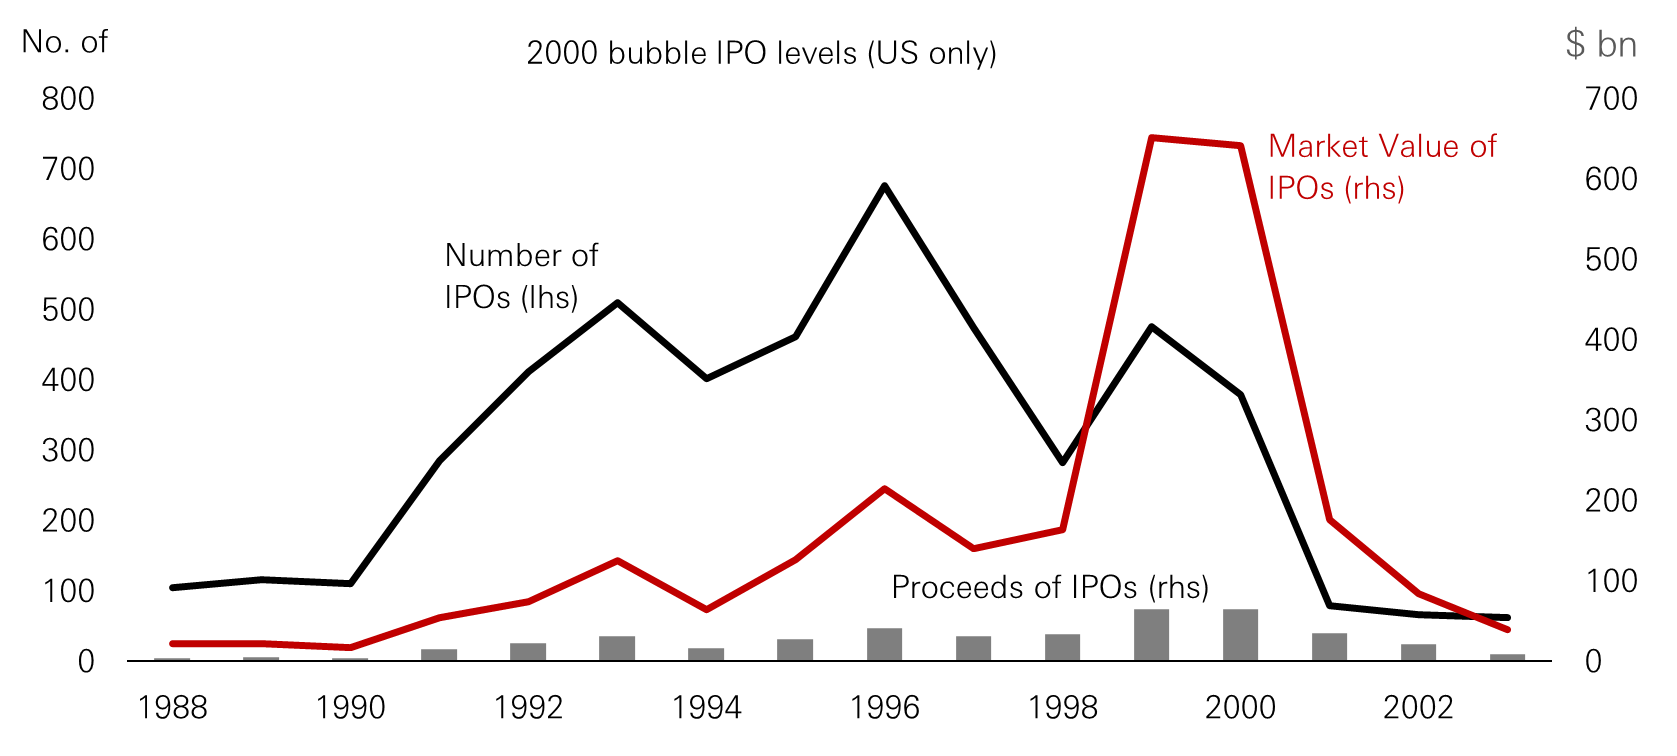
The dot-com winners of the late 1990s/early 2000s shared a familiar pattern. They promised to change how the world works, attracted extraordinary valuations, and were often loss-making. In 1999, burning cash was almost treated as a badge of future success. If the IPO priced well and traded up, early backers were rewarded. The chart below shows just how volatile IPO cycles can be, given the reliance on investor confidence and hype. Figure 5 below shows the number of IPO deals, proceeds raised and the values of the companies at the time.
Figure 5: IPO activity raced higher in 2000 – but fell quickly
Click image to enlarge
Source: Jay Ritter, University of Florida, Warrington College of Business, HSBC Asset Management, June 2026
SPACs boom (Special Purpose Acquisition Companies) followed the pandemic
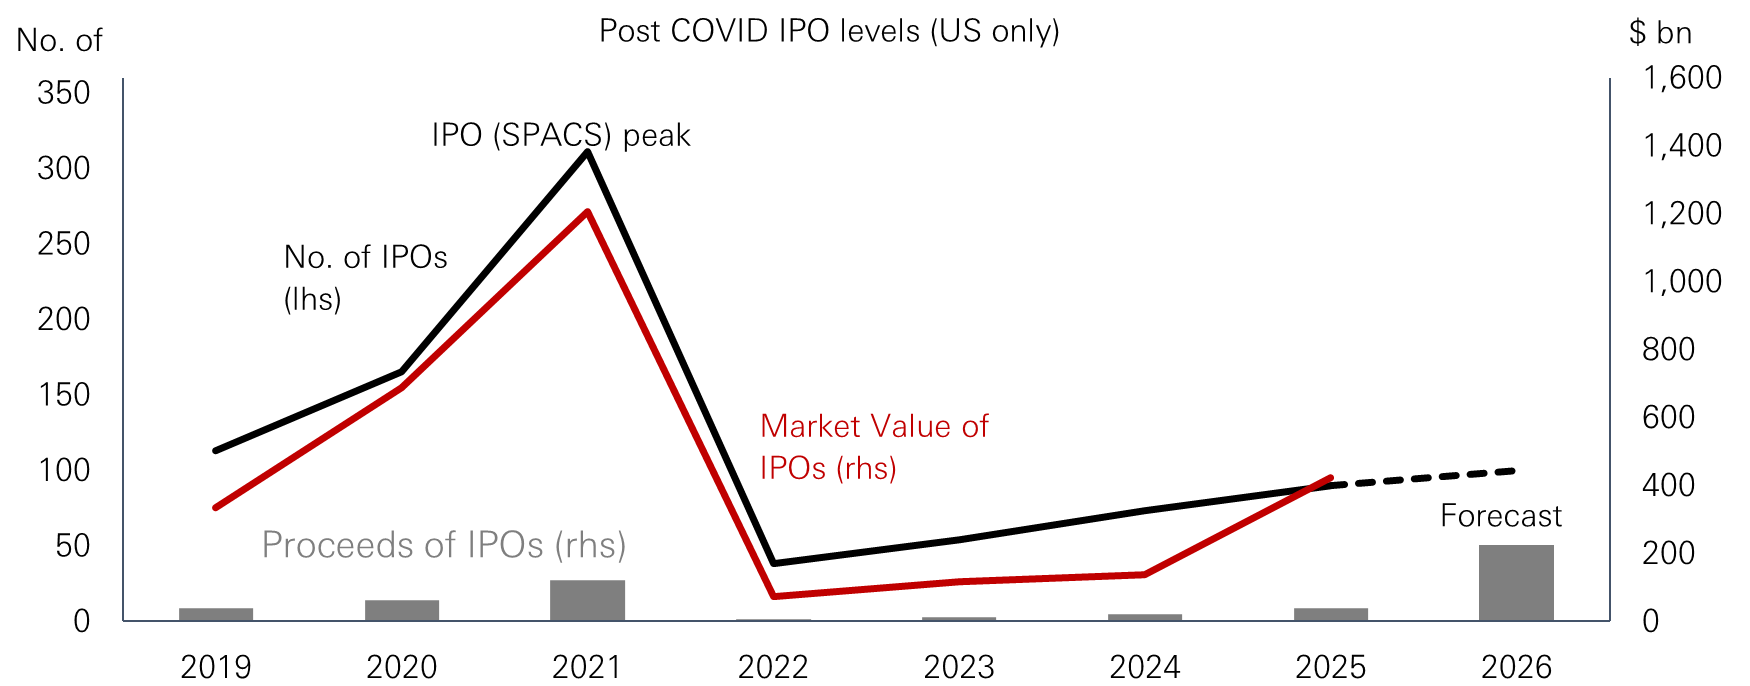
During the SPACs IPO boom sponsors and institutional investors often did well, but retail investors who bought in after the merger announcements, on average, did less well. 2020 looked good on paper: traditional IPOs ended 2020 with 76 per cent equity returns for investors. Names like Airbnb and DoorDash doubled on the first day. But that was the peak.
Looking at all 480 traditional IPOs from July 2020 through Dec 2021, average returns were negative from the offering price. This was an unusual IPO cycle which was more to do with massive pent-up demand to issue (and buy) paper post the pandemic helped by record low rates. In short, the 2020-2021 IPO/SPACs booms favoured the early sponsors and investors who got in cheap and exited earlier on.
Figure 6: Reviewing the IPO/SPACs post pandemic boom
Click image to enlarge
Source: Jay Ritter, University of Florida, Warrington College of Business, HSBC Asset Management, June 2026. Forecast period is from sales-side estimates.
We remind investors about key risks
We may not be at late-cycle extremes yet but it’s worth tracking some classic warning signs. In the final phase of the dot-com bubble (1999 to early 2000), insider selling surged. CEOs, founders and early investors sold billions of dollars’ worth of shares in the 12–18 months before the March 2000 peak, often cashing out near highs while public messaging was still generally positive. A key structural driver was the lock-up expiry (typically 180 days post-IPO). As the 1998–1999 IPO cohort unlocked, a wave of insider supply hit the market often as retail buying was still peaking. It looked something like this:
IPO → hype cycle → insider lock-ups expire → insider selling → retail often buys at top
Over the second half of 1999, for many it wasn’t a question of whether this was a bubble, but more a question of how big it would get and when it would pop. In the month before the Nasdaq peaked, insiders were estimated to be selling 23 times as many shares as they bought. Between September 1999 and July 2000, insiders of dot-com companies cashed out to the tune of USD43bn, twice the rate they’d sold at during 1997 and 1998. During 2000, individual investors continued to pour USD260bn into US equity funds. (Brian McCullough, How the Internet Happened (2018).
It's important to continue to focus on fundamentals over hype. The main areas to watch include:
- Valuation risk: early trading often assumes “perfect execution” of a business strategy
- Information: insiders and early backers typically know more about business risks, customer concentration and demand durability
- Supply overhang: lock-up expirations can create sharp, technical sell-offs even if the story is still hasn’t changed. Periods post lockup expiries can often create a better entry price.
- Profitability is uncertain: some businesses are scaling losses, making them more sensitive to a shift in sentiment or even rates. Look for visible revenue and margins plans over hype.
Theme 4: Re-equitisation – expensive shares offer a cheap currency
After a long phase of cheap money, where debt was cheaper than equities, could de-equitisation (think buy-backs) start to give way to more re-equitisation (think IPOs). Re-equitisation occurs when the total supply of equity in the stock market increases and happens when:
(1) Debt becomes expensive (swap debt for equity);
(2) Balance sheets need repair (need more equity versus debt); and
(3) High valuations make equities a cheap currency. This is what triggered the 1999–2000 IPO cycle.
Will equity finance increase? Perhaps. In Q1-26, four of the largest US hyper-scalers flagged combined 2026 capex of close to USD800bn (an 80 percent increase from the prior year). As capex started to outpace cash-flow generation, firms started to shift from pure cash-funding to leverage. Could the next move be equity-based finance? While most of the capex spending has come from cash or debt, at least one of the hyper-scalers has recently turned to the equity market with a share issue, to help fund AI capex.
Summary
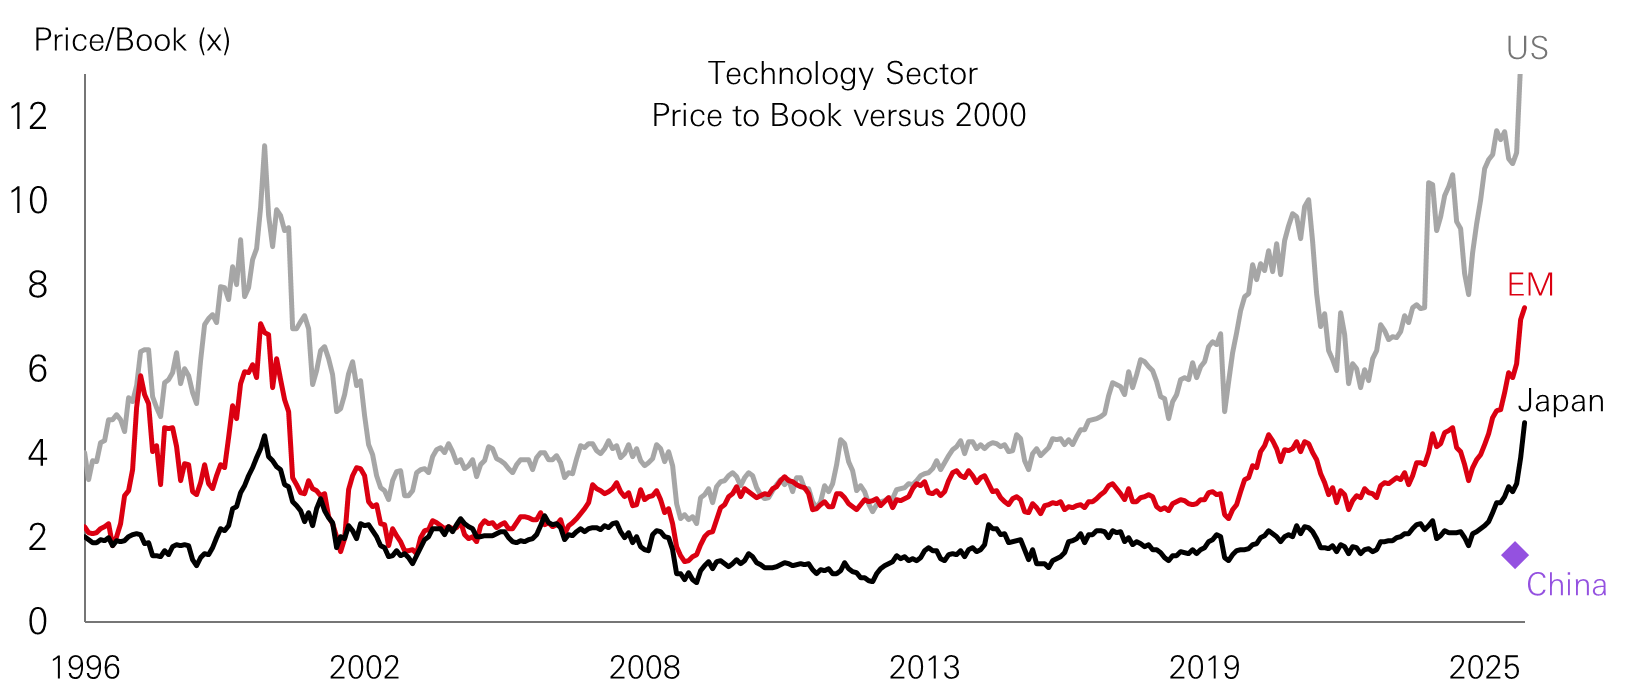
There are more mega cap IPOs forecast for 2026. But this is not just a US story, emerging markets are getting involved as they look to fund innovation. China has a burgeoning Tech sector that trades on a discount to the US (figure 7). We still favour broadening out beyond US mega-caps, especially given the structural under-allocation to RoW equities. Since 2020, there have been USD1.6 trillion of inflows to US equity funds, vs USD385 billion of inflows into non-US equity funds (EPFR, May 2026).
In this current cycle, we caution against being tempted into unforgiving entry points if expectations look stretched. Keep fundamentals, not hype, at the core. Even the most sophisticated investors can suffer from the Greater Fool Theory. Selective bottom-up stock picking and well diversified portfolios are key.
Figure 7: Technology stocks look more stretched on a Price to book measure
Click image to enlarge
Source: Refinitiv, Data-Stream as latest reported, HSBC Asset Management, June 2026. Note: China shows as above due to a noisy time series during and post the pandemic.
The views expressed above were held at the time of preparation and are subject to change without notice. Any forecast, projection or target where provided is indicative only and is not guaranteed in any way. HSBC Asset Management accepts no liability for any failure to meet such forecast, projection or target. This information shouldn’t be considered as an investment advice. The value of investments and any income from them can go down as well as up and investors may not get back the amount originally invested. Index returns assume reinvestment of all distributions and do not reflect fees or expenses. You cannot invest directly in an index. Diversification does not ensure a profit or protect against loss. Past performance does not predict future returns. For informational purposes only and should not be construed as a recommendation to invest in the specific country, product, strategy, sector, or security. This document provides a high-level overview of the recent economic environment. It is for marketing purposes and does not constitute investment research, investment advice nor a recommendation to any reader of this content to buy or sell investments. It has not been prepared in accordance with legal requirements designed to promote the independence of investment research and is not subject to any prohibition on dealing ahead of its dissemination.
Important information
For Professional Clients and intermediaries within countries and territories set out below; and for Institutional Investors and Financial Advisors in the US. This document should not be distributed to or relied upon by Retail clients/investors.
The value of investments and the income from them can go down as well as up and investors may not get back the amount originally invested. The performance figures contained in this document relate to past performance, which should not be seen as an indication of future returns. Future returns will depend, inter alia, on market conditions, investment manager’s skill, risk level and fees. Where overseas investments are held the rate of currency exchange may cause the value of such investments to go down as well as up. Investments in emerging markets are by their nature higher risk and potentially more volatile than those inherent in some established markets. Economies in emerging markets generally are heavily dependent upon international trade and, accordingly, have been and may continue to be affected adversely by trade barriers, exchange controls, managed adjustments in relative currency values and other protectionist measures imposed or negotiated by the countries and territories with which they trade. These economies also have been and may continue to be affected adversely by economic conditions in the countries and territories in which they trade.
The contents of this document may not be reproduced or further distributed to any person or entity, whether in whole or in part, for any purpose. All non-authorised reproduction or use of this document will be the responsibility of the user and may lead to legal proceedings. The material contained in this document is for general information purposes only and does not constitute advice or a recommendation to buy or sell investments. Some of the statements contained in this document may be considered forward looking statements which provide current expectations or forecasts of future events. Such forward looking statements are not guarantees of future performance or events and involve risks and uncertainties. Actual results may differ materially from those described in such forward-looking statements as a result of various factors. We do not undertake any obligation to update the forward-looking statements contained herein, or to update the reasons why actual results could differ from those projected in the forward-looking statements. This document has no contractual value and is not by any means intended as a solicitation, nor a recommendation for the purchase or sale of any financial instrument in any jurisdiction in which such an offer is not lawful. The views and opinions expressed herein are those of HSBC Asset Management at the time of preparation and are subject to change at any time. These views may not necessarily indicate current portfolios' composition. Individual portfolios managed by HSBC Asset Management primarily reflect individual clients' objectives, risk preferences, time horizon, and market liquidity. Foreign and emerging markets: investments in foreign markets involve risks such as currency rate fluctuations, potential differences in accounting and taxation policies, as well as possible political, economic, and market risks. These risks are heightened for investments in emerging markets which are also subject to greater illiquidity and volatility than developed foreign markets. This commentary is for information purposes only. It is a marketing communication and does not constitute investment advice or a recommendation to any reader of this content to buy or sell investments nor should it be regarded as investment research. It has not been prepared in accordance with legal requirements designed to promote the independence of investment research and is not subject to any prohibition on dealing ahead of its dissemination. This document is not contractually binding nor are we required to provide this to you by any legislative provision.
All data from HSBC Asset Management unless otherwise specified. Any third-party information has been obtained from sources we believe to be reliable, but which we have not independently verified.
HSBC Asset Management is the brand name for the asset management business of HSBC Group, which includes the investment activities that may be provided through our local regulated entities. HSBC Asset Management is a group of companies in many countries and territories throughout the world that are engaged in investment advisory and fund management activities, which are ultimately owned by HSBC Holdings Plc. (HSBC Group).
- In Australia, this document is issued by HSBC Bank Australia Limited ABN 48 006 434 162, AFSL 232595, for HSBC Global Asset Management (Hong Kong) Limited ARBN 132 834 149 and HSBC Global Asset Management (UK) Limited ARBN 633 929 718. This document is for institutional investors only and is not available for distribution to retail clients (as defined under the Corporations Act). HSBC Global Asset Management (Hong Kong) Limited and HSBC Global Asset Management (UK) Limited are exempt from the requirement to hold an Australian financial services license under the Corporations Act in respect of the financial services they provide. HSBC Global Asset Management (Hong Kong) Limited is regulated by the Securities and Futures Commission of Hong Kong under the Hong Kong laws, which differ from Australian laws. HSBC Global Asset Management (UK) Limited is regulated by the Financial Conduct Authority of the United Kingdom and, for the avoidance of doubt, includes the Financial Services Authority of the United Kingdom as it was previously known before 1 April 2013, under the laws of the United Kingdom, which differ from Australian laws;
- In Bermuda, this document is issued by HSBC Global Asset Management (Bermuda) Limited, of 37 Front Street, Hamilton, Bermuda which is licensed to conduct investment business by the Bermuda Monetary Authority;
- In France, Belgium, Netherlands, Luxembourg, Portugal, Greece, Finland, Norway, Denmark, Spain and Sweden this document is issued by HSBC Global Asset Management (France), a Portfolio Management Company authorised by the French regulatory authority AMF (no. GP99026);
- In Germany, this document is issued by HSBC Global Asset Management (Deutschland) GmbH which is regulated by BaFin (German clients) respective by the Austrian Financial Market Supervision FMA (Austrian clients);
- In Hong Kong, this document is issued by HSBC Global Asset Management (Hong Kong) Limited, which is regulated by the Securities and Futures Commission. This content has not been reviewed by the Securities and Futures Commission;
- In India, this document is issued by HSBC Asset Management (India) Pvt Ltd. which is regulated by the Securities and Exchange Board of India;
- In Italy, this document is issued by HSBC Global Asset Management (France), a Portfolio Management Company authorised by the French regulatory authority AMF (no. GP99026), through its Italian branch, regulated by Banca d’Italia and Commissione Nazionale per le Società e la Borsa (Consob);
- In Japan, this document is issued by HSBC Asset Management (Japan) Ltd (JRN 3010001124868), regulated by the Financial Services Agency;
- In Malta, this document is issued by HSBC Global Asset Management (Malta) Limited which is regulated and licensed to conduct Investment Services by the Malta Financial Services Authority under the Investment Services Act;
- In Mexico, this document is issued by HSBC Global Asset Management (Mexico), SA de CV, Sociedad Operadora de Fondos de Inversión, Grupo Financiero HSBC which is regulated by Comisión Nacional Bancaria y de Valores;
- In the United Arab Emirates, this document is issued by HSBC Investment Funds (Luxembourg) S.A. – Dubai Branch (Level 20, HSBC Tower, PO Box 66, Downtown Dubai, United Arab Emirates) regulated by the Capital Market Authority (CMA) in the UAE to conduct investment fund management, portfolios management, fund administration activities (CMA Category 2 license No.20200000336) and promotion activities (CMA Category 5 license No.20200000327).
- In the United Arab Emirates, this document is issued by HSBC Global Asset Management MENA, a unit within HSBC Bank Middle East Limited, U.A.E Branch, PO Box 66 Dubai, UAE, regulated by the Central Bank of the U.A.E. and the Capital Market Authority in the UAE under CMA license number 602004 for the purpose of this promotion and lead regulated by the Dubai Financial Services Authority. HSBC Bank Middle East Limited is a member of the HSBC Group and HSBC Global Asset Management MENA are marketing the relevant product only in a sub-distributing capacity on a principal-to-principal basis. HSBC Global Asset Management MENA may not be licensed under the laws of the recipient’s country of residence and therefore may not be subject to supervision of the local regulator in the recipient’s country of residence. One of more of the products and services of the manufacturer may not have been approved by or registered with the local regulator and the assets may be booked outside of the recipient’s country of residence.
- In Singapore, this document is issued by HSBC Global Asset Management (Singapore) Limited, which is regulated by the Monetary Authority of Singapore. The content in the document/video has not been reviewed by the Monetary Authority of Singapore;
- In Switzerland, this document is issued by HSBC Global Asset Management (Switzerland) AG. This document is intended for professional investor use only. For opting in and opting out according to FinSA, please refer to our website; if you wish to change your client categorization, please inform us. HSBC Global Asset Management (Switzerland) AG having its registered office at Gartenstrasse 26, PO Box, CH-8002 Zurich has a licence as an asset manager of collective investment schemes and as a representative of foreign collective investment schemes. Disputes regarding legal claims between the Client and HSBC Global Asset Management (Switzerland) AG can be settled by an ombudsman in mediation proceedings. HSBC Global Asset Management (Switzerland) AG is affiliated to the ombudsman FINOS having its registered address at Talstrasse 20, 8001 Zurich. There are general risks associated with financial instruments, please refer to the Swiss Banking Association (“SBA”) Brochure “Risks Involved in Trading in Financial Instruments”;
- In Taiwan, this document is issued by HSBC Global Asset Management (Taiwan) Limited which is regulated by the Financial Supervisory Commission R.O.C. (Taiwan);
- In Turkiye, this document is issued by HSBC Asset Management A.S. Turkiye (AMTU) which is regulated by Capital Markets Board of Turkiye. Any information here is not intended to distribute in any jurisdiction where AMTU does not have a right to. Any views here should not be perceived as investment advice, product/service offer and/or promise of income. Information given here might not be suitable for all investors and investors should be giving their own independent decisions. The investment information, comments and advice given herein are not part of investment advice activity. Investment advice services are provided by authorized institutions to persons and entities privately by considering their risk and return preferences, whereas the comments and advice included herein are of a general nature. Therefore, they may not fit your financial situation and risk and return preferences. For this reason, making an investment decision only by relying on the information given herein may not give rise to results that fit your expectations.
- In the UK, this document is issued by HSBC Global Asset Management (UK) Limited, which is authorised and regulated by the Financial Conduct Authority;
- In the US, this document is issued by HSBC Securities (USA) Inc., an HSBC broker dealer registered in the US with the Securities and Exchange Commission under the Securities Exchange Act of 1934. HSBC Securities (USA) Inc. is also a member of NYSE/FINRA/SIPC. HSBC Securities (USA) Inc. is not authorized by or registered with any other non-US regulatory authority. The contents of this document are confidential and may not be reproduced or further distributed to any person or entity, whether in whole or in part, for any purpose without prior written permission.
- In Chile, operations by HSBC's headquarters or other offices of this bank located abroad are not subject to Chilean inspections or regulations and are not covered by warranty of the Chilean state. Obtain information about the state guarantee to deposits at your bank or on www.cmfchile.cl;
- In Colombia, HSBC Bank USA NA has an authorized representative by the Superintendencia Financiera de Colombia (SFC) whereby its activities conform to the General Legal Financial System. SFC has not reviewed the information provided to the investor. This document is for the exclusive use of institutional investors in Colombia and is not for public distribution;
- In Costa Rica, the Fund and any other products or services referenced in this document are not registered with the Superintendencia General de Valores (“SUGEVAL”) and no regulator or government authority has reviewed this document, or the merits of the products and services referenced herein. This document is directed at and intended for institutional investors only.
- In Peru, HSBC Bank USA NA has an authorized representative by the Superintendencia de Banca y Seguros in Perú whereby its activities conform to the General Legal Financial System - Law No. 26702. Funds have not been registered before the Superintendencia del Mercado de Valores (SMV) and are being placed by means of a private offer. SMV has not reviewed the information provided to the investor. This document is for the exclusive use of institutional investors in Perú and is not for public distribution;
- In Uruguay, operations by HSBC's headquarters or other offices of this bank located abroad are not subject to Uruguayan inspections or regulations and are not covered by warranty of the Uruguayan state. Further information may be obtained about the state guarantee to deposits at your bank or on www.bcu.gub.uy.
Copyright © HSBC Global Asset Management Limited 2026. All rights reserved. No part of this publication may be reproduced, stored in a retrieval system, or transmitted, on any form or by any means, electronic, mechanical, photocopying, recording, or otherwise, without the prior written permission of HSBC Asset Management.
Content ID: D073647; Expiry Date: 19.07.2027