Asia outlook: Charging ahead in the Year of the Horse
Asia macro update
Asian economies have showed notable resilience to an increase in trade and geopolitical tensions, global policy uncertainty, and sporadic developed market (DM) bond volatility during 2025. Asia is adapting to a more complex global geoeconomic landscape while standing at the forefront of the global artificial intelligence (AI) revolution. The region’s economic prospects remain broadly solid in 2026, albeit with likely divergence across economies in their growth and policy paths amid local idiosyncrasies. We believe that fiscal policy stands ready to respond to growth disappointments in emerging market (EM) Asia as the region is approaching the end of its monetary easing cycle.
Growth resilience amid persistent external uncertainty
Several factors may have contributed to Asia’s resilience. Effective tariff rates have been lower than feared at the time of the initial announcement last April, thanks to exemptions and reversals in key sectors, especially semiconductors, electronics and pharmaceuticals, which make up the bulk of exports in some Asian economies. The US-China trade truce and US trade agreements with other Asian economies helped ease trade tensions.
The tariff headwind has also been cushioned by a front-loading of exports ahead of new levies, ongoing regional supply-chain reconfiguration, strong AI-led exports and investment, and policy easing in many economies. Disinflation helped real incomes of households while lower energy prices eased firms’ costs. Financial conditions also eased across much of Asia in 2025, aided by monetary easing, credit spread compression, equity market gains, and a weaker USD, while fiscal policy generally loosened.
Asia’s trade endures and adapts
As a major beneficiary of the AI-driven capex cycle, Asia has bolstered its tech exports and deepened regional trade. However, trade in non-AI / non-tech goods remained subdued (Fig. 1), reflecting the tariff impact, lower commodity prices, weak investment in these sectors, and strong competitive pressures from Chinese goods in non-China domestic markets. China’s trade surplus surged to a record of nearly USD1.2 trillion in 2025, boosted by its manufacturing/export competitiveness, increased investments abroad, and ongoing import substitution – which has been aided by strong policy push toward technology self-reliance (Fig. 2).
Fig. 1: Strong tech exports vs. subdued non-tech
per cent year-on-year, 3-month moving average
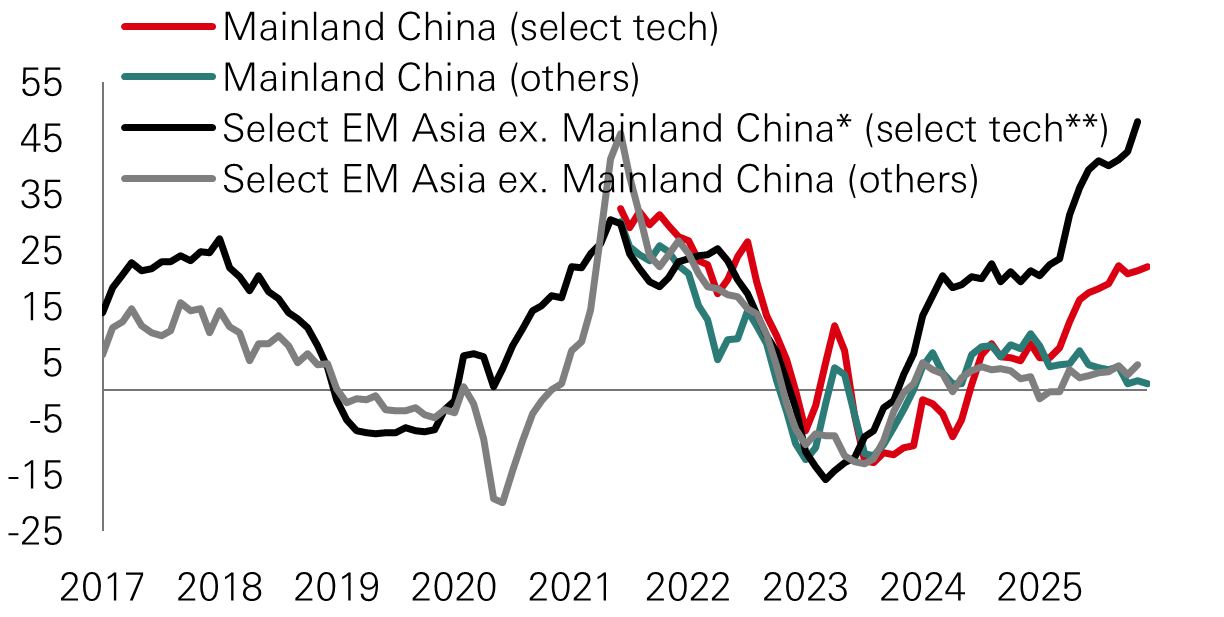
Note: *Includes India, Indonesia, Korea, Malaysia, Singapore, Taiwan, Thailand and Vietnam. **Includes semiconductors and electrical & electronic products Source: CEIC, HSBC Asset Management, January 2026
Fig. 2: China’s record-high trade surplus in 2025
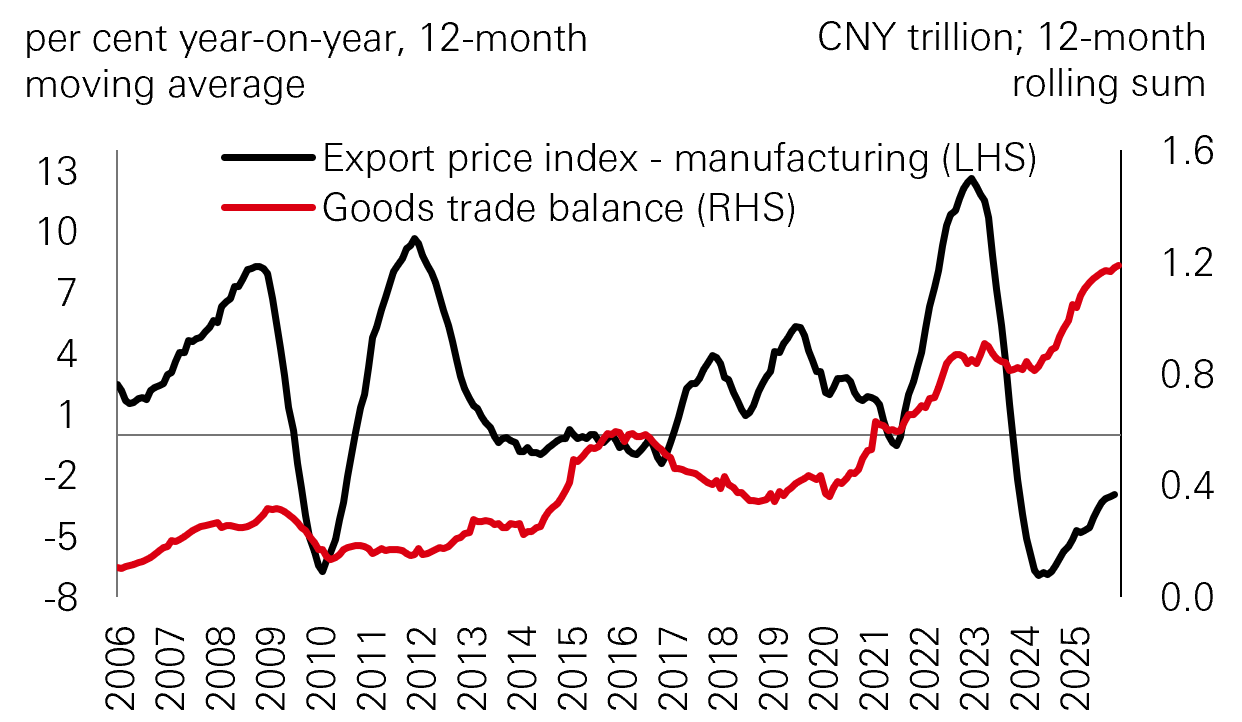
Source: CEIC, HSBC Asset Management, January 2026
Asia’s export growth is likely to moderate in 2026, as last year’s very strong tech export growth (largely driven by an AI capex boom in the US) will be hard to replicate, and global goods trade volume growth is forecasted to slow this year due to delayed impact of higher tariffs and trade policy uncertainty, according to the World Trade Organisation. Downside risks remain from renewed trade/geopolitical tensions and supply-chain disruptions.
That said, Asian exports may continue to expand at a decent pace this year on solid AI demand and the memory supercycle. Asia adapts to rising trade protectionism and geoeconomic fragmentation by diversifying export markets, shifting supply chains, deepening intra-regional trade, and increasing technological adoption. ASEAN is set to sign the world’s first comprehensive regional digital economy agreement this year to boost cross-border trade and services. India is accelerating its export diversification through free-trade agreements (FTAs) and strategic partnerships, as steep US tariffs have inflicted pain on labour-intensive sectors (Fig. 3). The India-EU FTA will be a big step towards this end, as India and the US remain engaged in negotiations to sign a trade deal.
Uneven recovery and K-shaped industrial growth
Last year’s AI boom led to upside growth surprises in some of the region’s tech-heavy economies. However, the AI-driven growth recovery has been K-shaped so far, with weakness in certain domestic demand-oriented and non-tech sectors. Spillovers of AI investment to investment in other sectors or the broader economy – e.g., through job and wage gains to boost domestic consumption – have been muted, largely due to the high capital intensity and dependence on imported machinery and equipment. The AI boom also contributed to divergent economic performances across the region, with underwhelming growth outturns in some of the more domestic demand-driven economies, such as Indonesia and the Philippines. In some cases, domestic political uncertainty affected confidence, policy efficacy and reform momentum (e.g., Philippines and Thailand), though pro-growth macro policies provided some offsets. Returning to political / policy stability would help restore economic growth. Overall, the outlook for Asia’s domestic demand likely hinges on policy support and local idiosyncrasies.
China achieved its 2025 real GDP growth target of 5 per cent, largely driven by strong exports and solid industrial production, even as domestic demand weakened in H2 partly on fading fiscal policy impulse and anti-involution efforts. Economic imbalances remain a challenge (Fig. 4), underscoring the urgent need for structural rebalancing toward a consumption- and services-driven economy for sustainable growth and fundamental reflation. Policymakers at the December Central Economic Work Conference (CEWC) prioritised expanding domestic demand through boosting consumption and stabilising investment for this year, the start of China’s new Five-Year Plan. While the policy shift towards domestic demand has started, the progress is likely to be gradual.
Supportive macro policies with fiscal prudence
Asian economies will need to lean more on domestic growth drivers this year amid lingering external uncertainty, potentially increasing pressure for policy stimulus and economic reforms. We expect economic growth to remain resilient in most parts of Asia, but the growth outlook will likely depend on each economy’s domestic strength and policy support. Amid heighted external uncertainty, fiscal policy has been active across the region, as low inflation in EM Asia enabled nearly synchronised monetary easing cycles last year. Due to lagged effect, easing from the prior year should continue to support the economy this year.
Fig. 3: India’s quest for export diversification
USD billion, 3-month moving average
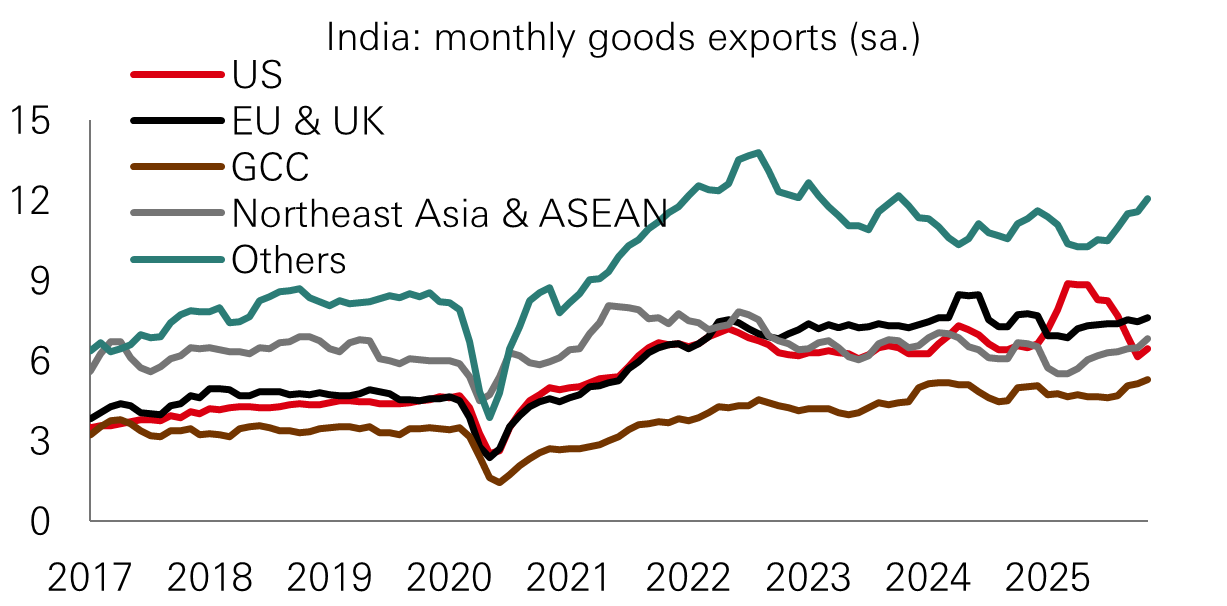
Source: CEIC, HSBC Asset Management, January 2026
Fig. 4: China needs to rebalance its economy
per cent year-on-year, 2024-2025 average growth
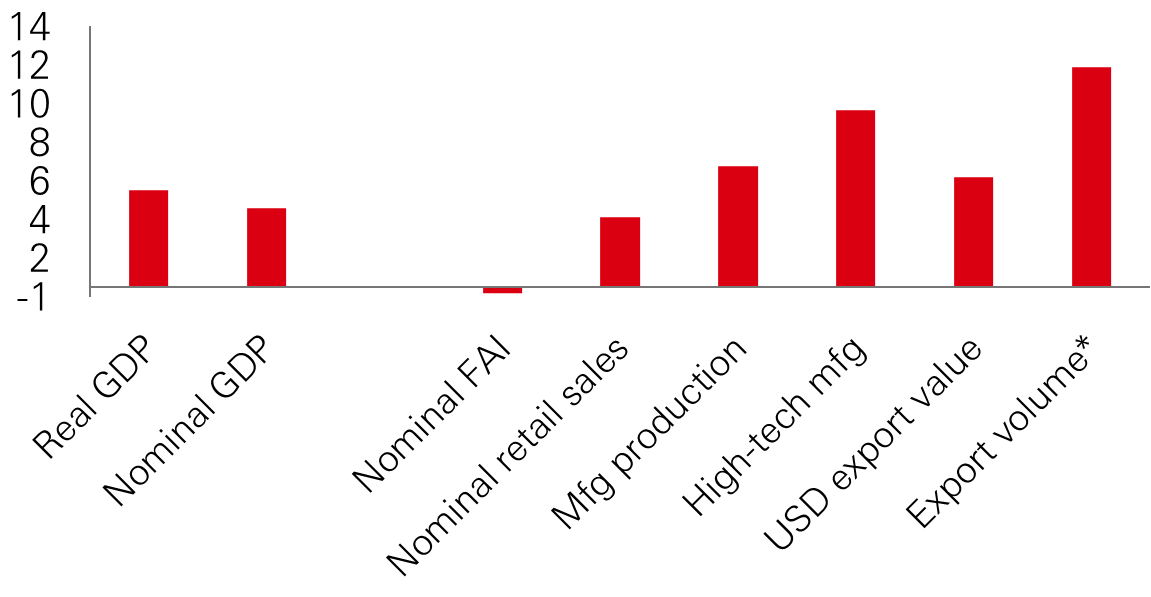
*Average monthly growth rate as of November 2025. FAI refers to Fixed Asset Investment. Mfg refers to Manufacturing. Source: CEIC, HSBC Asset Management, January 2026
The K-shaped recovery presents challenges for policymakers and may necessitate targeted, rather than universal, support. We expect fiscal policy to be less aggressive than in 2025 as Asian governments continue to strike a fine balance between fiscal prudence and growth support. Several years (or even decades) of improved policy credibility has helped safeguard EM Asia macro stability and kept external imbalances in check, as fiscal consolidation has strengthened debt sustainability. However, external headwinds and weak domestic revenue generation have affected fiscal consolidation efforts of several governments, reducing their fiscal headroom.
Still, we believe fiscal policy stands ready to respond to growth disappointments in Asia (Fig. 5). Fiscal support will likely be targeted and aligned with long-term strategic objectives. India’s fiscal rule changes from targeting the fiscal deficit to targeting debt in the FY27 Budget allows the government some flexibility in setting the annual fiscal deficit target. Infrastructure spending remains a key driver and an avenue for ASEAN to participate in AI democratisation. Industrial policy will likely place a high priority on mitigating the vulnerability of domestic industrial ecosystems to trade and geopolitical tensions, as shareholder-friendly / corporate governance reforms in economies such as Korea, Singapore and China should remain supportive of investor sentiment toward regional capital markets.
Fig. 5: Mixed credit/loan growth trajectories
Bank credit/loan growth (per cent year-on-year)
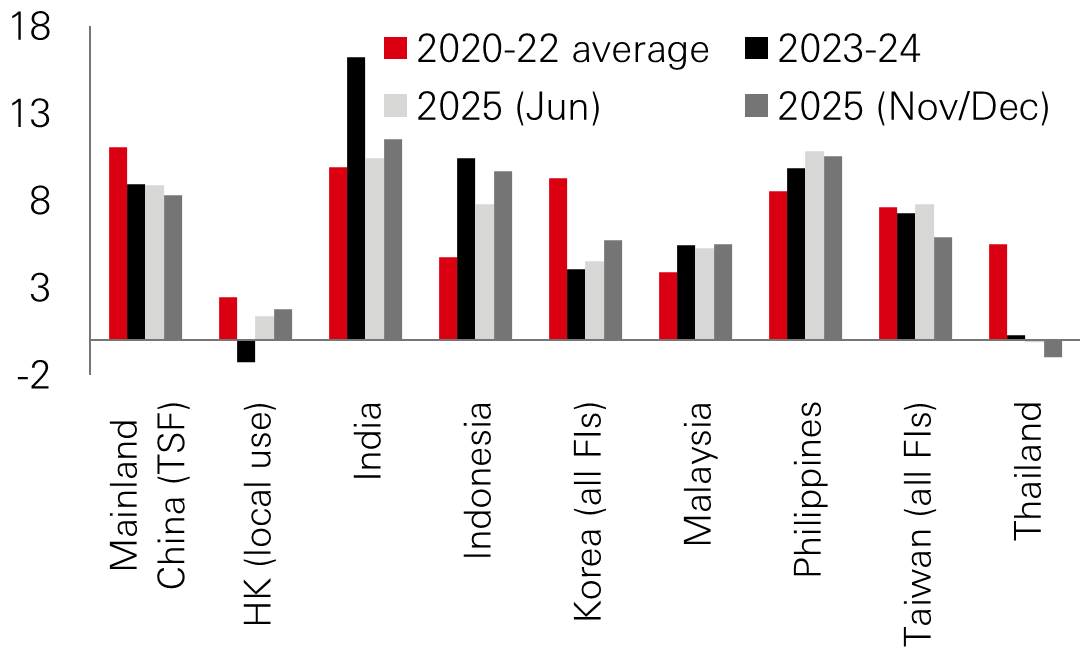
TSF refers to Total Social Financing. FIs refers to financial institutions. Source: CEIC, HSBC Asset Management, January 2026
Approaching the end of the rate-cutting cycle
Inflation is likely to “normalise” higher across the region this year from a low base but remain benign – within or closer to central bank targets. Food price normalisation and higher gold prices added to the upside recently. Core inflation has firmed in some (e.g., Korea, Malaysia and Singapore) amid solid growth momentum. The worst of China’s deflationary cycle appears to have ended, in our view, aided by reflationary policy efforts. But reflation is likely to be a slow burn and requires further reforms on structural rebalancing. This, coupled with a stronger CNY, could mean reduced deflationary spillovers from Chinese exports to the region. A new round of cuts in China to export tax rebates for solar and battery products could be seen as a mini-step toward external rebalancing to temper potential trade tensions. The resultant sector consolidation should be conducive for anti-involution.
We expect monetary policy to be less synchronised this year, as country-specific macro and financial conditions drive divergence. We see the scope of further modest and opportunistic easing in some ASEAN economies. But in general, we see the region as nearing the end of its rate-cutting cycle with the policy outlook hinging on evolving growth-inflation trends and financial stability considerations (including FX volatility). Liquidity conditions should remain supportive of policy transmission and domestic economies. Central banks in economies benefiting more from AI tailwinds could potentially pivot toward a hawkish policy stance, such as Singapore’s central bank.
AI tailwinds and challenges
Asia is a critical player in the global AI ecosystem, underpinned by its dominance in cutting-edge semiconductor manufacturing (e.g., in Korea and Taiwan) and innovative software development. India and Southeast Asian economies, especially Singapore, Malaysia and Vietnam, accrue gains through their roles in the AI value chain, from assembly to data centers. Mainland China's technological innovation is poised for strong policy-driven growth in 2026 and beyond, with AI placed at the centre of the country’s economic agenda and industrial upgrading plans. Asian governments have generally moved quickly to develop AI strategies and policies to foster an enabling macroeconomic environment. As technology diffusion grows, the benefits of AI could broaden out to include power grid investment, AI-enabled services and productivity gains in complementary sectors.
Asian economies are well positioned to reap productivity gains from AI investment and adoption, on account of their greater digital readiness. This helps to offset long-term growth constraints such as an aging population and global geoeconomic fragmentation. However, a broader AI adoption also raises concerns about potential job displacement, skill mismatches and economic disparities. Government support, such as more effective social safety nets, reskilling programs for affected workers, and regulations to promote ethical use of the technology may help mitigate risks of AI-induced disruptions and achieve an inclusive AI transition.
Asia fixed income
Uncertainties around global policies, global growth, interest rates and AI investments are shaping the current global investment landscape. In this environment, Asian bonds are expected to stay resilient, supported by the region’s favourable macroeconomic dynamics, structural reforms, supply chain realignment, and AI development. Economic growth is robust in Asia – particularly in India and ASEAN, inflation in the region remains benign, and mainland China’s pro-market stance adds further support. Solid fundamentals, relatively attractive yields and supportive technicals offer additional tailwinds for Asian bond performance in 2026.
Asia credit
Interest rate support fading, yet overall fundamentals hold firm
Following a strong 8.2 per cent return in the Asia credit market in 2025 – marking the third consecutive year of healthy gains (6.8 per cent annualised)1 – returns in 2026 may moderate, reflecting the US interest rate outlook and the more limited scope for spread tightening in the Asia investment grade space. However, solid credit fundamentals continue as a key driver of performance. There may be a potential for a cyclical upswing that could compress spreads in 2026 and unlock idiosyncratic alpha opportunities through credit selection.
A robust regional macro environment has helped sustain solid credit fundamentals in the Asia investment grade credit market, with credit rating upgrades outpacing downgrades and default risks staying low. Fallen angel risk has continued to subside, with only about USD1 billion (accounting for 0.2 per cent of Asia investment grade market) downgraded to high yield in 2025 (Fig. 6). Strong credit profiles of investment grade issuers should help support resilience through periods of market volatility. In the high yield space, default rates have fallen back to the low levels seen prior to 2020 while idiosyncratic risks over the past year have not meaningfully spilled over into the broader market. Asia high yield default rate is forecasted to further improve to 2.5 per cent in 2026,2 thanks to the clean-up of the sector over the last few years.
Fig. 6: Improving Asia credit fundamentals
Asia investment grade bonds downgraded to high yield

Source: JPMorgan January 2026 report, data as of 31 December 2025.
Valuations and technicals
Credit spreads in both the Asia investment grade and high yield markets are at historically tight levels, and the ongoing compression of spreads has reduced differentiation across rating categories. That said, all-in yields remain compelling.
Within Asia investment grade credit, while spreads remain tight, valuations are relatively attractive due to their shorter duration (Fig. 7). Meanwhile, Asia high yield bonds offer high carry and spread compression potential compared to global peers (Fig. 8).
The technical backdrop of the Asia credit market with a shrinking supply in the past three years has been favourable for the market. Local currency funding should also continue to reduce US dollar supply while broadening sources of income. In 2026, new supply is expected to pick up to about USD 200 billion – though still well below the previous levels seen in 2019-21.2 We anticipate that this will be well-absorbed as demand in the region remains robust, driven by Asian wealth creation and excess liquidity.
Fig. 7: Investment grade bonds valuations

Note*: Euro IG Corp yields listed are USD hedged. Source: JPMorgan, BofA, 31 December 2025.
Fig. 8: High yield bonds valuations

Note**: Euro HY Corp yields listed are USD hedged. Source: JPMorgan, BofA, 31 December 2025.
Key views
Within the investment grade market, we see opportunities in select regional bank and insurance subordinated debt, mainland China TMT, Indonesia commodities and utilities. Within the high yield market, we are seeing opportunities in mainland China industrials, India commodities and cyclicals, select India renewables, India financials, regional high yield commodities, frontier sovereigns and select banks.
Asia local currency bonds
After delivering a 7.8 per cent return in 2025 on a USD unhedged basis,3 Asia local currency bonds continue to warrant a positive outlook, supported by sound fundamentals in Asian economies, a constructive view on regional currencies, and the relatively high yields (Fig. 9).
Inflation rates in the region are close to or below central bank targets, and there may be room for modest monetary policy easing (Fig. 10). In mainland China, monetary policy is expected to remain moderately loose and will be used to support growth and price recovery, with the flexible and efficient use of various policy tools. The PBoC has also pledged to promote high-level financial opening-up and RMB internationalisation, overall positive for RMB bonds. In India, inflation is expected to stay below the central bank target, leaving room for further monetary easing depending on growth conditions. Coupled with the prospect of a prudent fiscal budget for FY2027, this creates a supportive environment for India bonds. Although Bloomberg’s decision on the potential inclusion of India government bonds in its global aggregate index has been deferred to mid-2026, the continued eligibility review means that a positive medium-term tailwind remains in place.
Overall, Asian currencies have been undervalued on a Real Effective Exchange Rate (REER) basis over the past few decades. Asia currencies may strengthen, driven by AI flows, widening rate differential versus the US dollar, stronger external positions and tech supply chain realignment. We expect a modest RMB appreciation in line with the domestic policy agenda. The INR, which has been under pressure, could recover depending on the tariff situation and equity sentiment. The MYR is expected to benefit from domestic growth prospects and supply chain diversion on AI related activities. The KRW’s recent correction can be viewed as a medium to longer term opportunity, with potential domestic market reforms and index inclusion serving as drivers.
Fig. 9: Real rates across Asia are attractive
10-year government bond yields (per cent)

Real yield uses 10-year government bond rate and subtracts latest year-on-year CPI figure as of 12 January 2026. Nominal yield is based on the 10-year government bond rate. Source: Bloomberg, HSBC Asset Management, as of 12 January 2026.
Fig. 10: Inflation is in central bank comfort zone in most major Asia economies
Inflation (per cent)

Actual CPI figures are latest year-on-year figures released, latest data as of 12 January 2026. Source: Bloomberg, HSBC Asset Management, as of 12 January 2026.
Potential risks
We remain mindful of risks arising from uncertainties around the US Fed’s rate cut path, lingering concerns over the global growth outlook, and global policies. Additionally, idiosyncratic credit events, such as issuer-specific issues, may cause short-term market fluctuations, as we have seen in late 2025.
Asian equities
The Asia Pacific ex Japan equity market demonstrated remarkable resilience and growth in 2025, achieving a 32.3 per cent return in USD terms, the best annual performance since 2017.4 The region outperformed global equities and US equities by 7.2 per cent and 11.7 per cent, respectively, during the year.4
Globally, market leadership and corporate profits are expected to keep broadening out, especially to Asia and other emerging markets. This indicates that economic de-risking and improved policy have potentially made Asia structurally less volatile. Asia’s overall economic outlook remains favourable for equity markets, supported by regional trade integration, resilient domestic demand, and accommodative fiscal and monetary policies. The outlook for Asian equities in 2026 remains constructive, with markets offering broad sector diversification and high-quality growth opportunities.
Potential risks to the Asian equity market, which we closely monitor, could stem from geopolitical events, US-China relations, AI super cycle marked by elevated valuations, and trajectory of the monetary easing cycle.
Earnings growth and valuations
Looking ahead, Asian equities should continue to be supported by solid earnings outlook, proactive policy measures, structural reforms, and technological advancement. Earnings growth is forecasted to accelerate from 10 per cent in 2025 to 20 per cent for Asia Pacific ex Japan equities in 2026, led by strength in Korea and Taiwan (Fig. 11).
While valuations have risen, they continue to stay reasonable overall, trading at 14.8x 12-month forward P/E (Fig. 12). Most Asian markets are trading around their long-term average forward P/E ratios, while Korea and parts of ASEAN screen notably cheap relative to history. Regional valuation disparities highlight the diversity of return opportunities, emphasising the importance of active management in navigating this environment.
Fig. 11: Earnings growth remains solid
Market consensus EPS growth (per cent)
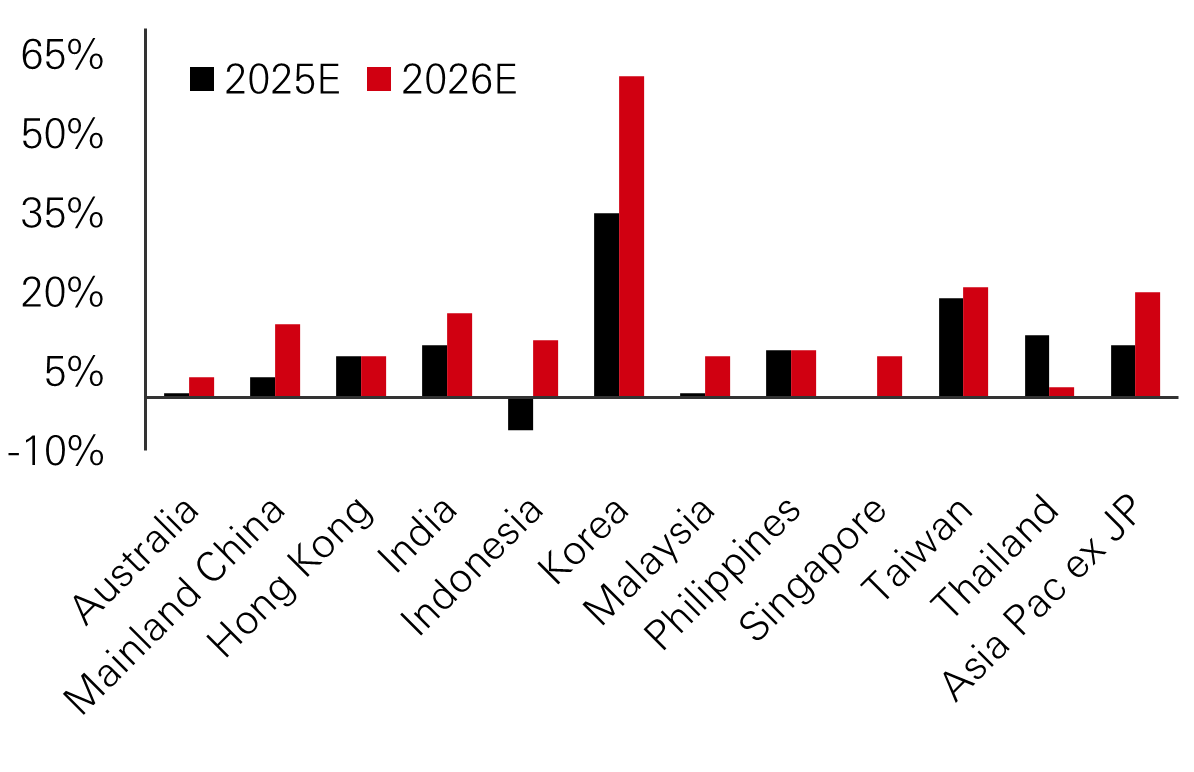
Source: IBES, Goldman Sachs Research, 10 January 2026; Asia Pac ex JP refers to the MSCI Asia Pacific excluding Japan index.
Fig. 12: Asian markets’ valuation underpinned by strong earnings growth and solid fundamentals
12-month forward P/E ratio (x)

Source: MSCI, Bloomberg, Goldman Sachs Research, 10 January 2026; Asia Pac ex JP refers to the MSCI Asia Pacific excluding Japan index.
Korea and Taiwan
Within the region, Korea and Taiwan stood out in 2025, posting gains of 99 per cent and 39 per cent, respectively.4 We believe that AI-related sectors can continue to be a market driver in 2026, with Korea and Taiwan—markets with high contribution to AI innovation—poised to benefit further. Any acceleration in global AI capex is positive for Korea and Taiwan, as both have high exposure to key semiconductor and IT hardware segments that benefit from increased spending on AI servers and data centers. This includes Korea’s strength in memory and high bandwidth memory (HBM) and Taiwan’s concentration in advance chip manufacturing. Additionally, further progress on corporate governance reforms in Korea would be well received by investors and could potentially boost market sentiment.
India
Indian equities returns were relatively muted in 2025, but we expect a potential reversal in 2026. The market is expected to benefit from the domestic economy’s strong structural growth drivers, the government’s ongoing reform initiatives – including last year’s overhaul to the Goods & Services Tax (GST) regime, accommodative central bank policies, and a continued structural shift in household savings. Moreover, the national budget, to be announced in February, could act as a driver for the market. Externally, any moderation in tariffs between the US and India could serve as a meaningful catalyst, particularly for export-driven sectors, though it is worth noting that India’s exports of goods to the US is only 2 per cent of GDP. Overall, policies aimed at fostering economic growth, infrastructure development, and job creation are likely to support investor sentiment and reinforce the structural themes driving India’s long-term investment potential.
While Indian equities’ valuations are relatively rich, they have moderated and the P/E premium over Asian peers has narrowed. The latest earnings season reflects stronger cyclical/profit growth momentum under a supportive policy environment, despite clear divergence.
Fig. 13: India’s drive to push consumption growth amid GST overhauls and tax cuts

Source: Reserve Bank of India, HSBC Asset Management, December 2025.
Our strategy maintains a focus on large-cap stocks with solid earnings growth. We have a preference for financials – including private sector banks, non-banking financial companies, and structural domestic plays such as asset management firms. We also favor the real estate sector, driven by a strengthening demand upcycle, and consumer sectors, both staples and discretionary, where GST reforms and tax incentives are expected to benefit consumers.
China
Chinese equities could continue to see momentum in 2026, following last year’s 31.2 per cent return.5 China’s macro policies are expected to stay supportive of economic growth and capital markets. Combined with China’s export and manufacturing competitiveness, this should help provide a cushion against potential headwinds. Aside from pro-market policies, other market drivers include innovation, capital flows and corporate earnings.
China is clearly positioning innovation as a pillar of the country’s long-term strategy. Chinese companies are increasingly holding leading roles in areas of AI, robotics and innovative drugs. Overall, growing AI adoption and tech breakthroughs should enhance productivity and benefit AI-related names.
Capital flows from domestic investors should continue to drive the market, even following the record high inflows in southbound capital flows into Hong Kong listed equities last year. Generally, the relatively low equity participation and the huge amount in excess savings by mainland Chinese households indicate that there is significant room for reallocation towards equities that could result in meaningful inflows.6 In the context of global portfolios, Chinese equities’ low correlation with other major markets (at 0.33 vs developed markets)7 and attractive valuation discounts could encourage more global inflows (Fig. 14).
Fundamentally, Chinese equities’ corporate earnings are seeing signs of stabilisation, with a structural improvement in return on equity (ROE), which has been underpinned by corporate driven actions, shareholder return initiatives, government support for the private sector, and new tech leaders.
Fig. 14: Chinese equities trade at a discount
MSCI China discount on forward P/E
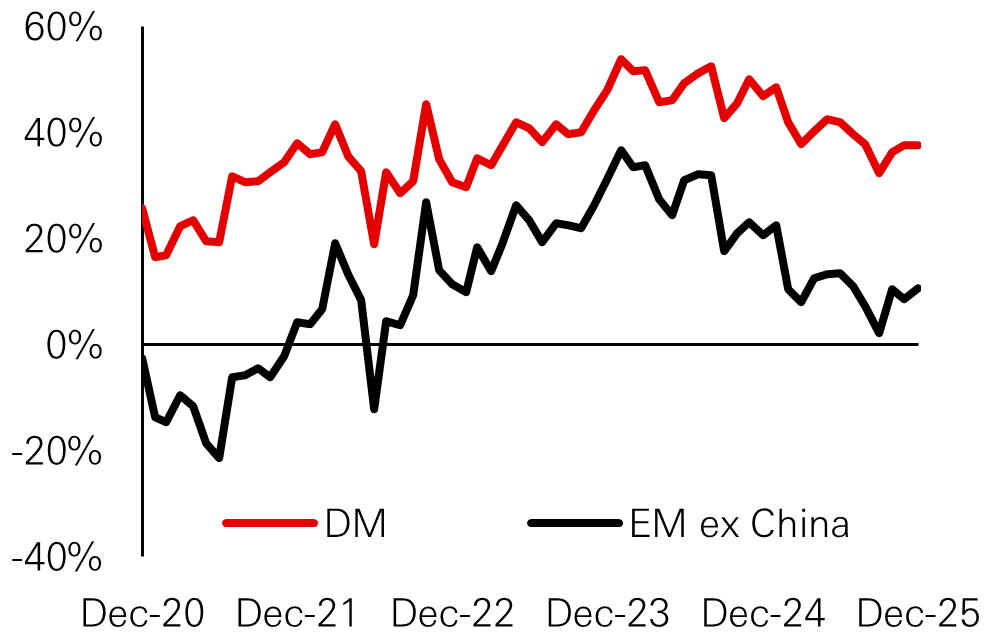
Source: Goldman Sachs Research, December 2025.
Note 1: Source is Bloomberg, using JACI Composite, as of 31 December 2025.
Note 2: Source is JPMorgan December 2025 report, data as of 21 November 2025. Source: HSBC Asset Management, as of January 2026.
Note 3: Asia local currency bonds: Markit iBoxx ALBI Index Unhedged USD. Source is Markit, Bloomberg, 31 December 2025. Source: HSBC Asset Management, as of January 2026.
Note 4: Asia Pacific ex Japan equity: MSCI AC Asia Pacific ex Japan Net Total Return USD Index; Global equity: MSCI AC World Net Total Return USD Index, US equity: S&P 500 Index (TR), Korea equity: MSCI Korea Net USD Index, Taiwan equities: MSCI Taiwan Net USD Index. Source is Bloomberg, MSCI, 31 December 2025. Source: Bloomberg, HSBC Asset Management, as of January 2026
Note 5: Chinese equities represented by MSCI China Net USD Return. Source is Bloomberg, MSCI, 31 December 2025.
Note 6: Goldman Sachs Global Investment Research, November 2025.
Note 7: Based on weekly correlation between Chinese equities (MSCI China Index) and developed market equities (MSCI World Index) over 5 years. Source is MSCI, Bloomberg as of 31 December 2025.
Past performance does not predict future returns. Any forecast, projection or target contained in this presentation is for information purposes only and is not guaranteed in any way. HSBC Asset Management accepts no liability for any failure to meet such forecasts, projections or targets. The views expressed above were held at the time of preparation and are subject to change without notice. The information provided does not constitute any investment recommendation or advice. Diversification does not ensure a profit or protect against loss. For illustrative purposes only.
Important information
For Professional Clients and intermediaries within countries and territories set out below; and for Institutional Investors and Financial Advisors in the US. This document should not be distributed to or relied upon by Retail clients/investors.
or Professional Clients and intermediaries within countries and territories set out below; and for Institutional Investors and Financial Advisors in the US. This document should not be distributed to or relied upon by Retail clients/investors.
The value of investments and the income from them can go down as well as up and investors may not get back the amount originally invested. The performance figures contained in this document relate to past performance, which should not be seen as an indication of future returns. Future returns will depend, inter alia, on market conditions, investment manager’s skill, risk level and fees. Where overseas investments are held the rate of currency exchange may cause the value of such investments to go down as well as up. Investments in emerging markets are by their nature higher risk and potentially more volatile than those inherent in some established markets. Economies in emerging markets generally are heavily dependent upon international trade and, accordingly, have been and may continue to be affected adversely by trade barriers, exchange controls, managed adjustments in relative currency values and other protectionist measures imposed or negotiated by the countries and territories with which they trade. These economies also have been and may continue to be affected adversely by economic conditions in the countries and territories in which they trade.
The contents of this document may not be reproduced or further distributed to any person or entity, whether in whole or in part, for any purpose. All non-authorised reproduction or use of this document will be the responsibility of the user and may lead to legal proceedings. The material contained in this document is for general information purposes only and does not constitute advice or a recommendation to buy or sell investments. Some of the statements contained in this document may be considered forward looking statements which provide current expectations or forecasts of future events. Such forward looking statements are not guarantees of future performance or events and involve risks and uncertainties. Actual results may differ materially from those described in such forward-looking statements as a result of various factors. We do not undertake any obligation to update the forward-looking statements contained herein, or to update the reasons why actual results could differ from those projected in the forward-looking statements. This document has no contractual value and is not by any means intended as a solicitation, nor a recommendation for the purchase or sale of any financial instrument in any jurisdiction in which such an offer is not lawful. The views and opinions expressed herein are those of HSBC Asset Management at the time of preparation and are subject to change at any time. These views may not necessarily indicate current portfolios' composition. Individual portfolios managed by HSBC Asset Management primarily reflect individual clients' objectives, risk preferences, time horizon, and market liquidity. Foreign and emerging markets: investments in foreign markets involve risks such as currency rate fluctuations, potential differences in accounting and taxation policies, as well as possible political, economic, and market risks. These risks are heightened for investments in emerging markets which are also subject to greater illiquidity and volatility than developed foreign markets. This commentary is for information purposes only. It is a marketing communication and does not constitute investment advice or a recommendation to any reader of this content to buy or sell investments nor should it be regarded as investment research. It has not been prepared in accordance with legal requirements designed to promote the independence of investment research and is not subject to any prohibition on dealing ahead of its dissemination. This document is not contractually binding nor are we required to provide this to you by any legislative provision.
All data from HSBC Asset Management unless otherwise specified. Any third-party information has been obtained from sources we believe to be reliable, but which we have not independently verified. HSBC Asset Management is the brand name for the asset management business of HSBC Group, which includes the investment activities that may be provided through our local regulated entities. HSBC Asset Management is a group of companies in many countries and territories throughout the world that are engaged in investment advisory and fund management activities, which are ultimately owned by HSBC Holdings Plc. (HSBC Group).
- In Australia, this document is issued by HSBC Bank Australia Limited ABN 48 006 434 162, AFSL 232595, for HSBC Global Asset Management (Hong Kong) Limited ARBN 132 834 149 and HSBC Global Asset Management (UK) Limited ARBN 633 929 718. This document is for institutional investors only and is not available for distribution to retail clients (as defined under the Corporations Act). HSBC Global Asset Management (Hong Kong) Limited and HSBC Global Asset Management (UK) Limited are exempt from the requirement to hold an Australian financial services license under the Corporations Act in respect of the financial services they provide. HSBC Global Asset Management (Hong Kong) Limited is regulated by the Securities and Futures Commission of Hong Kong under the Hong Kong laws, which differ from Australian laws. HSBC Global Asset Management (UK) Limited is regulated by the Financial Conduct Authority of the United Kingdom and, for the avoidance of doubt, includes the Financial Services Authority of the United Kingdom as it was previously known before 1 April 2013, under the laws of the United Kingdom, which differ from Australian laws;
- In Bermuda, this document is issued by HSBC Global Asset Management (Bermuda) Limited, of 37 Front Street, Hamilton, Bermuda which is licensed to conduct investment business by the Bermuda Monetary Authority;
- In France, Belgium, Netherlands, Luxembourg, Portugal, Greece, Finland, Norway, Denmark and Sweden this document is issued by HSBC Global Asset Management (France), a Portfolio Management Company authorised by the French regulatory authority AMF (no. GP99026);
- In Germany, this document is issued by HSBC Global Asset Management (Deutschland) GmbH which is regulated by BaFin (German clients) respective by the Austrian Financial Market Supervision FMA (Austrian clients);
- In Hong Kong, this document is issued by HSBC Global Asset Management (Hong Kong) Limited, which is regulated by the Securities and Futures Commission. This content has not been reviewed by the Securities and Futures Commission;
- In India, this document is issued by HSBC Asset Management (India) Pvt Ltd. which is regulated by the Securities and Exchange Board of India;
- In Italy and Spain, this document is issued by HSBC Global Asset Management (France), a Portfolio Management Company authorised by the French regulatory authority AMF (no. GP99026) and through the Italian and Spanish branches of HSBC Global Asset Management (France), regulated respectively by Banca d’Italia and Commissione Nazionale per le Società e la Borsa (Consob) in Italy, and the Comisión Nacional del Mercado de Valores (CNMV) in Spain;
- In Malta, this document is issued by HSBC Global Asset Management (Malta) Limited which is regulated and licensed to conduct Investment Services by the Malta Financial Services Authority under the Investment Services Act;
- In Mexico, this document is issued by HSBC Global Asset Management (Mexico), SA de CV, Sociedad Operadora de Fondos de Inversión, Grupo Financiero HSBC which is regulated by Comisión Nacional Bancaria y de Valores;
- In the United Arab Emirates, this document is issued by HSBC Investment Funds (Luxembourg) S.A. – Dubai Branch (Level 20, HSBC Tower, PO Box 66, Downtown Dubai, United Arab Emirates) regulated by the Securities and Commodities Authority (SCA) in the UAE to conduct investment fund management, portfolios management, fund administration activities (SCA Category 2 license No.20200000336) and promotion activities (SCA Category 5 license No.20200000327).
- In the United Arab Emirates, this document is issued by HSBC Global Asset Management MENA, a unit within HSBC Bank Middle East Limited, U.A.E Branch, PO Box 66 Dubai, UAE, regulated by the Central Bank of the U.A.E. and the Securities and Commodities Authority in the UAE under SCA license number 602004 for the purpose of this promotion and lead regulated by the Dubai Financial Services Authority. HSBC Bank Middle East Limited is a member of the HSBC Group and HSBC Global Asset Management MENA are marketing the relevant product only in a sub-distributing capacity on a principal-to-principal basis. HSBC Global Asset Management MENA may not be licensed under the laws of the recipient’s country of residence and therefore may not be subject to supervision of the local regulator in the recipient’s country of residence. One of more of the products and services of the manufacturer may not have been approved by or registered with the local regulator and the assets may be booked outside of the recipient’s country of residence.
- In Singapore, this document is issued by HSBC Global Asset Management (Singapore) Limited, which is regulated by the Monetary Authority of Singapore. The content in the document/video has not been reviewed by the Monetary Authority of Singapore;
- In Switzerland, this document is issued by HSBC Global Asset Management (Switzerland) AG. This document is intended for professional investor use only. For opting in and opting out according to FinSA, please refer to our website; if you wish to change your client categorization, please inform us. HSBC Global Asset Management (Switzerland) AG having its registered office at Gartenstrasse 26, PO Box, CH-8002 Zurich has a licence as an asset manager of collective investment schemes and as a representative of foreign collective investment schemes. Disputes regarding legal claims between the Client and HSBC Global Asset Management (Switzerland) AG can be settled by an ombudsman in mediation proceedings. HSBC Global Asset Management (Switzerland) AG is affiliated to the ombudsman FINOS having its registered address at Talstrasse 20, 8001 Zurich. There are general risks associated with financial instruments, please refer to the Swiss Banking Association (“SBA”) Brochure “Risks Involved in Trading in Financial Instruments”;
- In Taiwan, this document is issued by HSBC Global Asset Management (Taiwan) Limited which is regulated by the Financial Supervisory Commission R.O.C. (Taiwan);
- In Turkiye, this document is issued by HSBC Asset Management A.S. Turkiye (AMTU) which is regulated by Capital Markets Board of Turkiye. Any information here is not intended to distribute in any jurisdiction where AMTU does not have a right to. Any views here should not be perceived as investment advice, product/service offer and/or promise of income. Information given here might not be suitable for all investors and investors should be giving their own independent decisions. The investment information, comments and advice given herein are not part of investment advice activity. Investment advice services are provided by authorized institutions to persons and entities privately by considering their risk and return preferences, whereas the comments and advice included herein are of a general nature. Therefore, they may not fit your financial situation and risk and return preferences. For this reason, making an investment decision only by relying on the information given herein may not give rise to results that fit your expectations.
- In the UK, this document is issued by HSBC Global Asset Management (UK) Limited, which is authorised and regulated by the Financial Conduct Authority;
- In the US, this document is issued by HSBC Securities (USA) Inc., an HSBC broker dealer registered in the US with the Securities and Exchange Commission under the Securities Exchange Act of 1934. HSBC Securities (USA) Inc. is also a member of NYSE/FINRA/SIPC. HSBC Securities (USA) Inc. is not authorized by or registered with any other non-US regulatory authority. The contents of this document are confidential and may not be reproduced or further distributed to any person or entity, whether in whole or in part, for any purpose without prior written permission.
- In Chile, operations by HSBC's headquarters or other offices of this bank located abroad are not subject to Chilean inspections or regulations and are not covered by warranty of the Chilean state. Obtain information about the state guarantee to deposits at your bank or on www.cmfchile.cl;
- In Colombia, HSBC Bank USA NA has an authorized representative by the Superintendencia Financiera de Colombia (SFC) whereby its activities conform to the General Legal Financial System. SFC has not reviewed the information provided to the investor. This document is for the exclusive use of institutional investors in Colombia and is not for public distribution;
- In Costa Rica, the Fund and any other products or services referenced in this document are not registered with the Superintendencia General de Valores (“SUGEVAL”) and no regulator or government authority has reviewed this document, or the merits of the products and services referenced herein. This document is directed at and intended for institutional investors only.
- In Peru, HSBC Bank USA NA has an authorized representative by the Superintendencia de Banca y Seguros in Perú whereby its activities conform to the General Legal Financial System - Law No. 26702. Funds have not been registered before the Superintendencia del Mercado de Valores (SMV) and are being placed by means of a private offer. SMV has not reviewed the information provided to the investor. This document is for the exclusive use of institutional investors in Perú and is not for public distribution;
- In Uruguay, operations by HSBC's headquarters or other offices of this bank located abroad are not subject to Uruguayan inspections or regulations and are not covered by warranty of the Uruguayan state. Further information may be obtained about the state guarantee to deposits at your bank or on www.bcu.gub.uy.
Copyright © HSBC Global Asset Management Limited 2026. All rights reserved. No part of this publication may be reproduced, stored in a retrieval system, or transmitted, on any form or by any means, electronic, mechanical, photocopying, recording, or otherwise, without the prior written permission of HSBC Asset Management.
Content ID: D063550; Expiry Date: 01.02.2027