The Evolution of the North American Energy Infrastructure Business Model
Introduction
The energy infrastructure industry, particularly in North America, is well-established, deeply entrenched in the economy, and has been developed over decades of investments. Energy infrastructure companies play a crucial role in the energy value chain, providing stable cash flows through long-term contracts with fixed fees. Typically structured as C-Corps or Master Limited Partnerships (“MLPs”), these companies build and operate pipelines, storage facilities, processing and fractionation plants to transport natural gas, crude oil, and other products from wells to end-use and export markets. The recent shift in the midstream model towards self-funded growth, high-return capital investment, and enhanced contractual agreements has significantly strengthened the financial position of the sector. This transformation has led to reduced business risk, improved valuation multiples, and greater resilience to market volatility, making these companies less correlated with fluctuations in commodity prices. In recent years, energy infrastructure companies have also become pivotal in facilitating the energy transition, supporting growth in LNG exports, petrochemical feedstock, power consumption for AI applications and data centers, as well as opportunities in new technologies such as carbon capture and storage (“CCS”).
Figure 1: Map of North American energy infrastructure
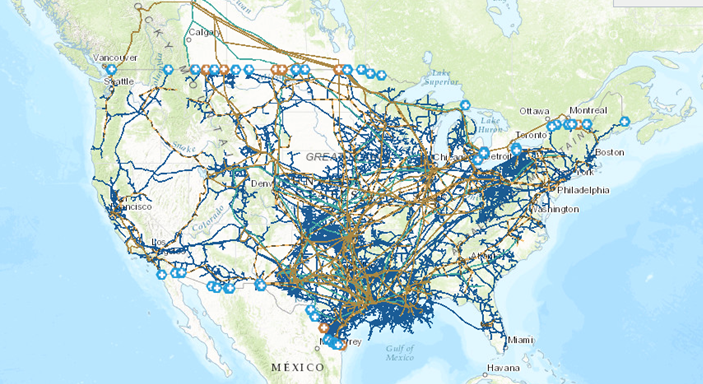
Source: American Petroleum Institute.
What is Energy Infrastructure
Value Chain Overview: Energy infrastructure companies are integral to the energy value chain. They build and operate pipelines, storage, processing, and extraction facilities to transport natural gas, crude oil, and other products from wells to end-use and export markets. Typically structured as C-Corps or MLPs, these companies enjoy stable cash flows underpinned by long-term contracts with fixed fees, making them relatively indifferent to the price fluctuations of commodity prices. Moreover, they are pivotal in facilitating the energy transition by also pursuing opportunities in biofuels and new technologies such as CCS and hydrogen. Energy infrastructure companies, often referred to as "midstream" (Fig. 2), connect exploration and production companies ("upstream"), which extract oil and gas, to refiners, utilities, and chemical companies ("downstream"), which convert hydrocarbons into useful products for distribution to end markets.
Figure 2: Energy infrastructure value chain
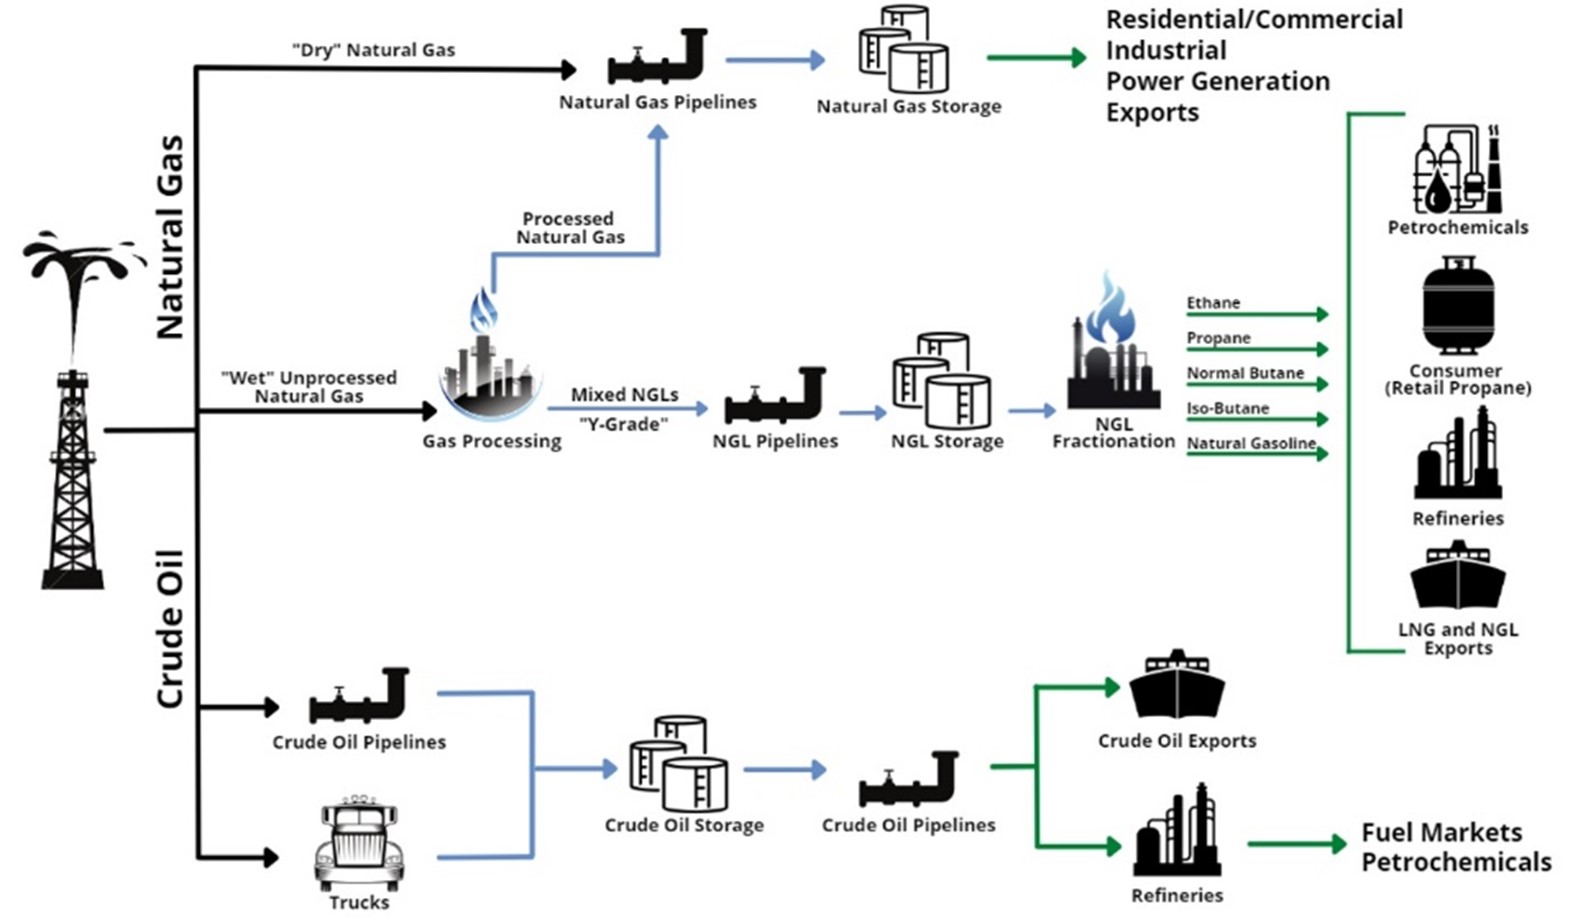
Source: RBN Energy.
For crude oil, midstream assets include a network of small-diameter gathering lines that transport oil from wells to central facilities. These central facilities feed large-diameter long-haul pipelines to storage terminals, refineries, and export facilities. Refineries use various processes to convert crude oil into refined petroleum products such as gasoline. Long-haul refined pipelines then transport these products from refineries to end markets. In the context of natural gas, midstream assets consist of small-diameter gathering lines that transport raw ("wet") natural gas from wells to gas processing (or treating) facilities. These facilities remove water, natural gas liquids (“NGLs”), and other impurities from the raw gas stream. The purified ("dry") natural gas is then compressed and moved into gas transmission pipelines. In order to optimize efficiency and capacity, compressors along these pipelines increase the pressure, which is then reduced for local storage or delivery through smaller distribution pipelines to LNG export facilities, as well as industrial, commercial, and residential customers. The extracted NGLs ("Y grade") are sent to fractionators via dedicated long-haul NGL pipelines or trucks. These facilities separate the NGL stream into higher-value purity products, such as ethane, propane, butane, and condensate, which are ultimately used as feedstock for petrochemical plants and refineries, or as heating fuels.
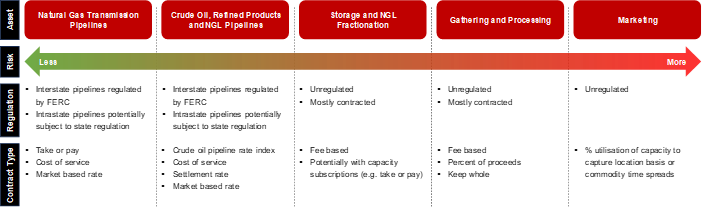
Contract Types: The contracts for midstream assets vary in their cash flow stability, reflecting exposure to volume and commodity price fluctuations. Natural gas transmission pipelines offer the most stable cash flows due to their fully regulated rates by the Federal Energy Regulatory Commission (“FERC”) for interstate assets or by state agencies for intrastate assets. Pipeline operators contract the asset, selling capacity to shippers on a long-term fixed-fee basis, which often includes minimum volume commitments under "take-or-pay" contracts. These contracts ensure shippers are obligated to pay for a predetermined amount of capacity per day throughout the contract's duration, regardless of actual usage, eliminating both volume and commodity price risk.
Crude oil, refined products, and NGL pipelines are also regulated by FERC or state agencies, providing access to shippers on a toll-road basis where shippers pay a distance-based tariff on the actual volume shipped. Shippers usually nominate the capacity they require, and once the pipeline operator allocates this capacity, each allocation is pro-rated accordingly. In recent years, the construction of new liquid pipelines has been supported by long-term take-or-pay contracts to mitigate the upfront capital investment risks.
Beyond long-haul pipelines, storage and NGL fractionation assets are supported by fee-based contracts with unregulated rates. This implies that the operator charges a fee based on volumes shipped, which may vary depending on factors such as volume and price ceilings set by regulators, though generally, these contracts do not have commodity price risk. Instead, fee-based revenues carry volumetric risk, with contract durations generally ranging from one to five years.
Closer to the wellhead are gathering and processing (“G&P”) assets, which tend to exhibit significant variability with volumetric sensitivity to commodity prices and underlying well depletion. As wells decline, volumes flowing through G&P assets decline unless new wells are connected, necessitating greater maintenance capital to support cash flows. Certain contracts are fixed-fee, while others, such as percentage-of-proceeds or keep-whole contracts, contain an in-kind payment with commodity and volumetric risk, including a percentage of the energy content shipped.
Additionally, some larger midstream companies maintain internal marketing or optimisation groups that use a portion of the pipeline or storage capacity to arbitrage pricing differentials, regional pricing, or time spreads. These cash flows represent opportunistic spread capture, which is fully hedged and not speculative, but they are the least stable and transparent.
Figure 3: Energy infrastructure value chain
Source: RBN Energy.
Corporate Structure: Historically, most energy infrastructure assets were owned by integrated oil and gas producers, refiners and utility companies. Over the past two decades, these assets have gradually migrated into independent, publicly traded energy infrastructure companies structured as C-Corps and MLPs. The MLP structure was the primary vehicle used to hold midstream assets and experienced significant growth through 2014 due to two key tax advantages: (i) MLPs do not pay corporate income taxes, instead pass all their income to investors, similarly to Real Estate Investment Trusts (“REITs”). Investors receive a K-1 tax form, rather than a 1099 form, which reflects their allocated proportional share of income and losses, thus increasing or decreasing their basis; (ii) MLPs pay distributions rather than dividends, and these are treated as tax-deferred returns of capital. These distributions are not taxed when received and contribute to lower the investor’s basis.
Regarding the organizational structure, the ownership of an MLP is divided between a General Partner (GP) with a 2 per cent ownership stake and Limited Partners (LPs) with a 98 per cent ownership stake. The GP interest is typically owned by the management team or the corporate sponsor and holds effective control of the partnership. Historically, the GP would also have carried interest economics on the distributed cash, referred to as Incentive Distribution Rights (IDRs), which could be as high as 50 per cent of all incremental distributed cash above a certain threshold. Many of these IDRs have been eliminated due to investor pressure. Since 2014, there has been a notable shift away from the MLP structure towards converting or merging MLPs into C-Corps (Fig. 4), resulting in a significant decrease in the number of midstream companies, from a peak of 79 in 2014 to 30 today.
Figure 4: Midstream Market Capitalisation and Number of Companies
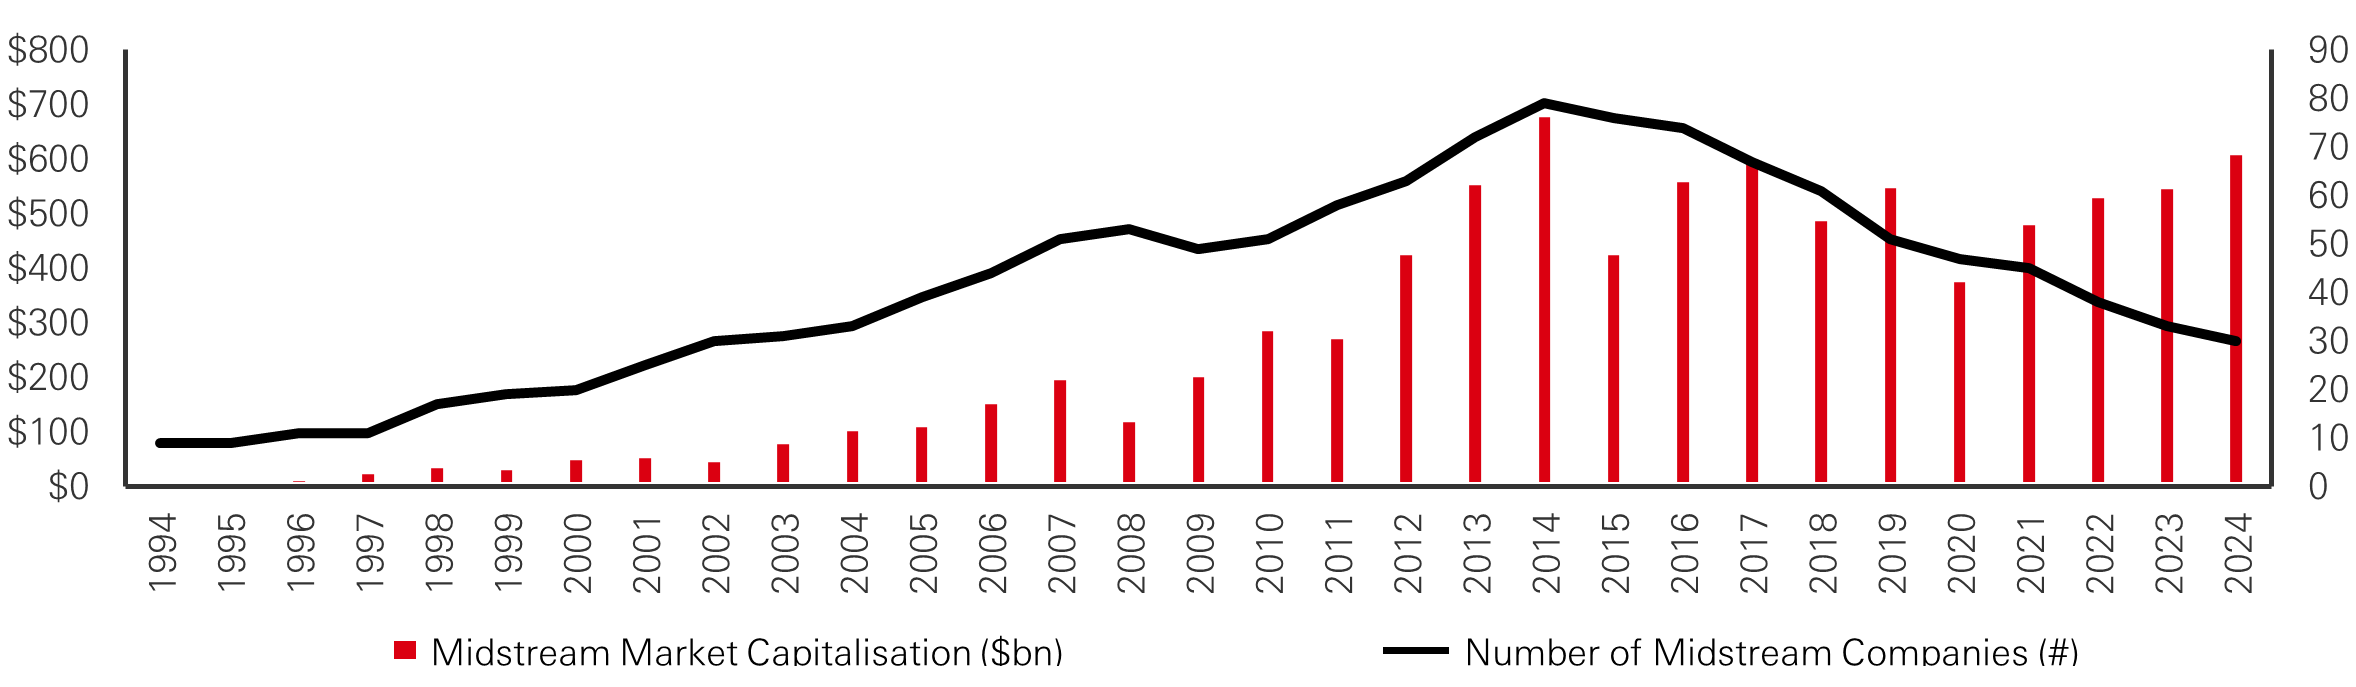
Source: Bloomberg, Wall Street research.
This shift has been driven by several factors. Investor pressure has highlighted the suboptimal governance protections that LPs have within an MLP structure, where GPs retain full control and have limited fiduciary obligations. Additionally, the exclusion of MLPs from many large equity benchmark indices, such as the S&P 500, has triggered a shift to the C-Corp structure to better capture the significant growth in passive fund flows. Finally, converting to a C-Corp structure eliminates the cumbersome K-1 tax filing, which can be an issue for many investors. This industry consolidation has facilitated economies of scale, enabling larger companies to streamline operations, improve efficiencies, and enhance their negotiating power with oil and gas producers. This has resulted in a higher proportion of take-or-pay and fixed-fee contracts.
How the Midstream Model Has Evolved
Historically, the traditional midstream model relied on asset dropdowns into the MLP structure, either through the construction of new assets or the acquisition of existing assets, to enhance distributable cash flow (“DCF”). DCF is defined as EBITDA minus interest expense and maintenance capital expenditures, and represents effectively recurring cash flows. MLPs were fast-growing companies that the market rewarded with high EV/EBITDA multiples. Therefore, asset dropdowns created significant value through multiple re-rating. Valuation multiples peaked in late 2014 (Fig. 5) and have been stabilising in the 8-10x range post Covid.
Figure 5: Valuation multiples and distribution yield
EV/EBITDA (x)
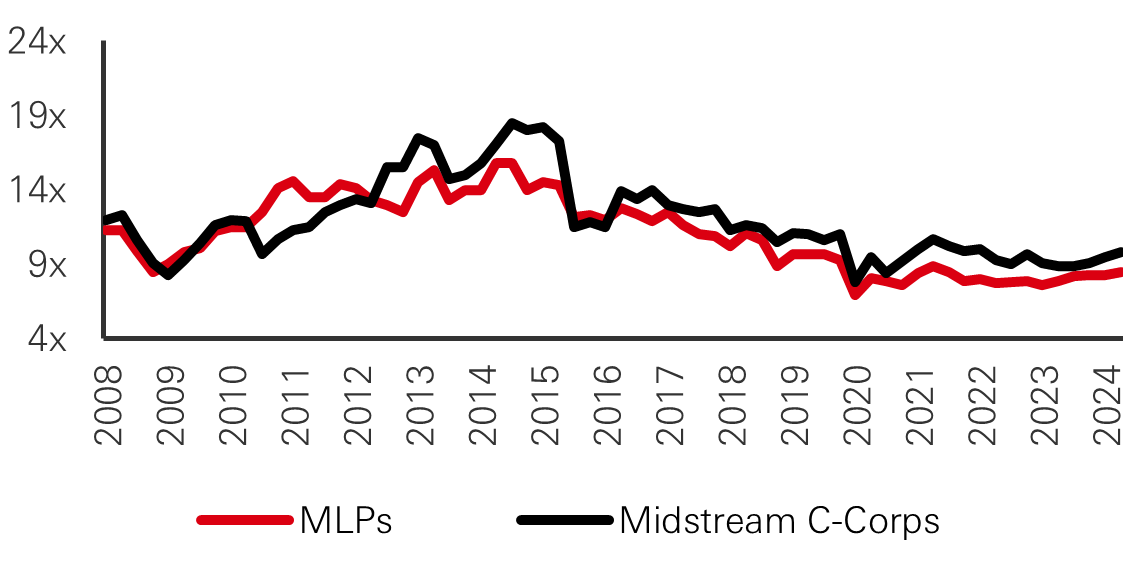
Distribution Yield (per cent)
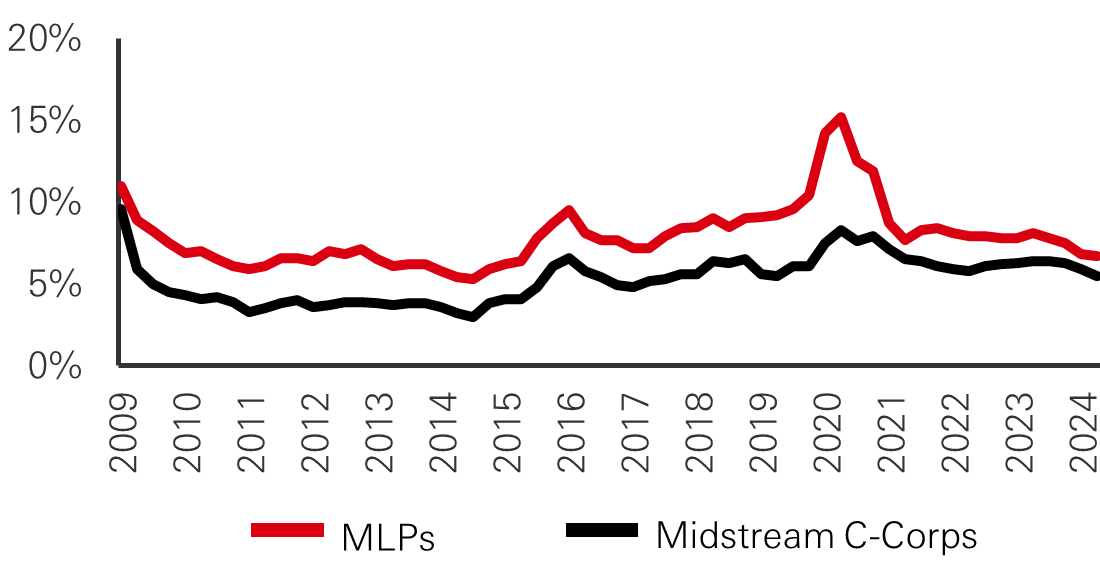
Source: Bloomberg, Wall Street research.
Over the past decade, the emergence of North American shale basins has facilitated a significant expansion of energy infrastructure, resulting in robust DCF growth for publicly listed MLPs. These infrastructure investments allowed the connection of new supply to demand and export markets, which also benefitted end markets with low-cost and more secure supplies. The MLP model was characterized by high DCF payout (or low distribution coverage) ratios, with most recurring cash flows being distributed to investors. To finance the substantial pipeline of growth investments, MLPs accessed debt and equity markets (Fig. 6), reaching a peak of over $40bn in annual equity issuances in 2013-14. Companies were ultimately valued based on the growth of their distributions, considering the stability of their cash flows and the sustainability of their payout ratios.
Figure 6: Equity and debt issuance
Equity Issuance ($bn)

Debt Issuance ($bn)
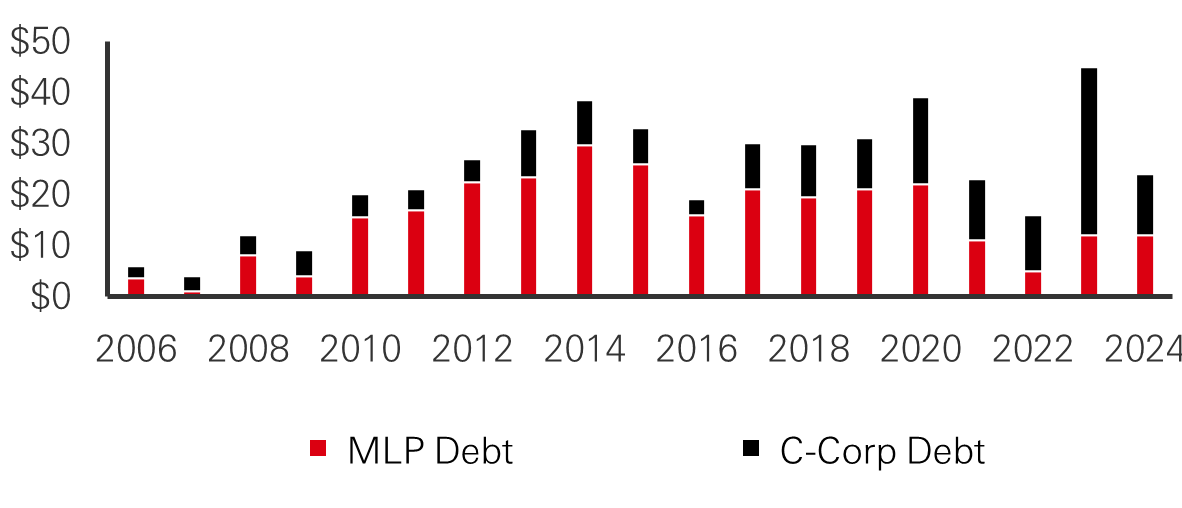
Source: Bloomberg, Wall Street research.
Following the increased volatility in commodity prices during 2014-15 and an unfavourable federal tax ruling in 2018, the midstream model had to adapt to investors’ changing expectations. These expectations included a higher cost of capital and a push toward more sustainable, self-funded cash flow generation that was less reliant on capital markets. This revised approach led to distribution cuts, lower payout ratios, and reduced leverage levels (Fig. 7 and 8) as access to equity capital markets for funding new growth investments vanished. Furthermore, with lower growth prospects, investors demanded the elimination of IDRs, as the sharing of cash flows between GPs and LPs became disproportionate, leading many MLPs to convert to C-Corps.
Figure 7: Leverage evolution
Debt/EBITDA

Source: Bloomberg, Wall Street research.
Investors also urged management teams to reduce capital expenditures due to increased scepticism about project returns, to focus on positive free cash flow generation with less emphasis on DCF, and to prioritise healthier balance sheets with lower leverage.
Figure 8: Dividend payout and capital expenditures
Dividend Payout (per cent)
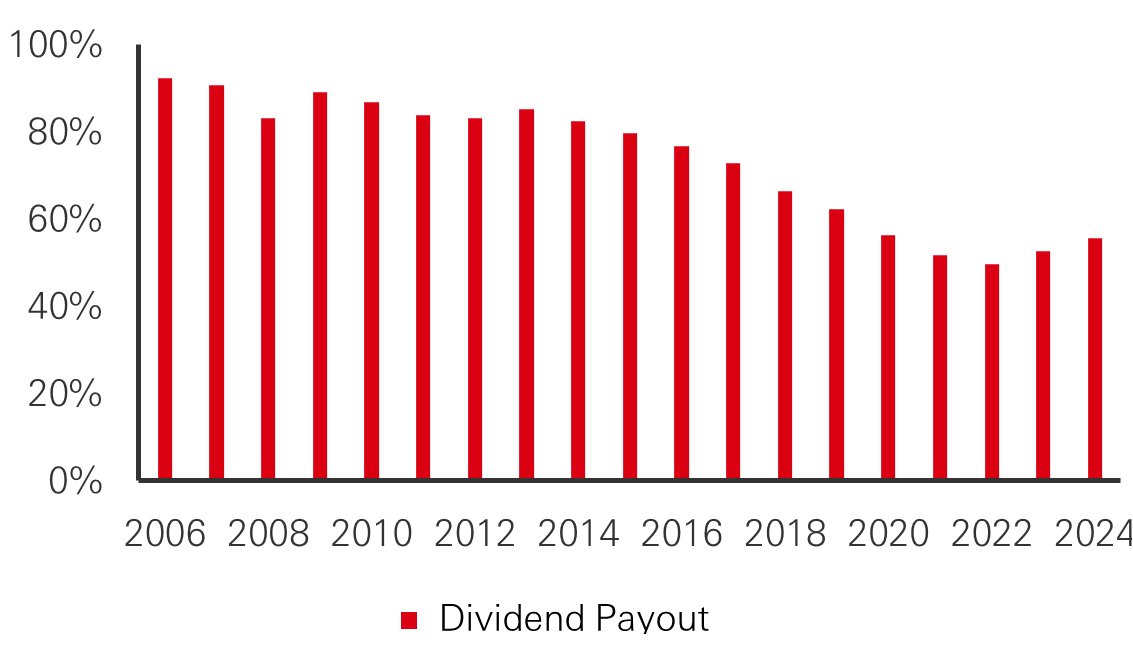
Capital Expenditures ($bn)
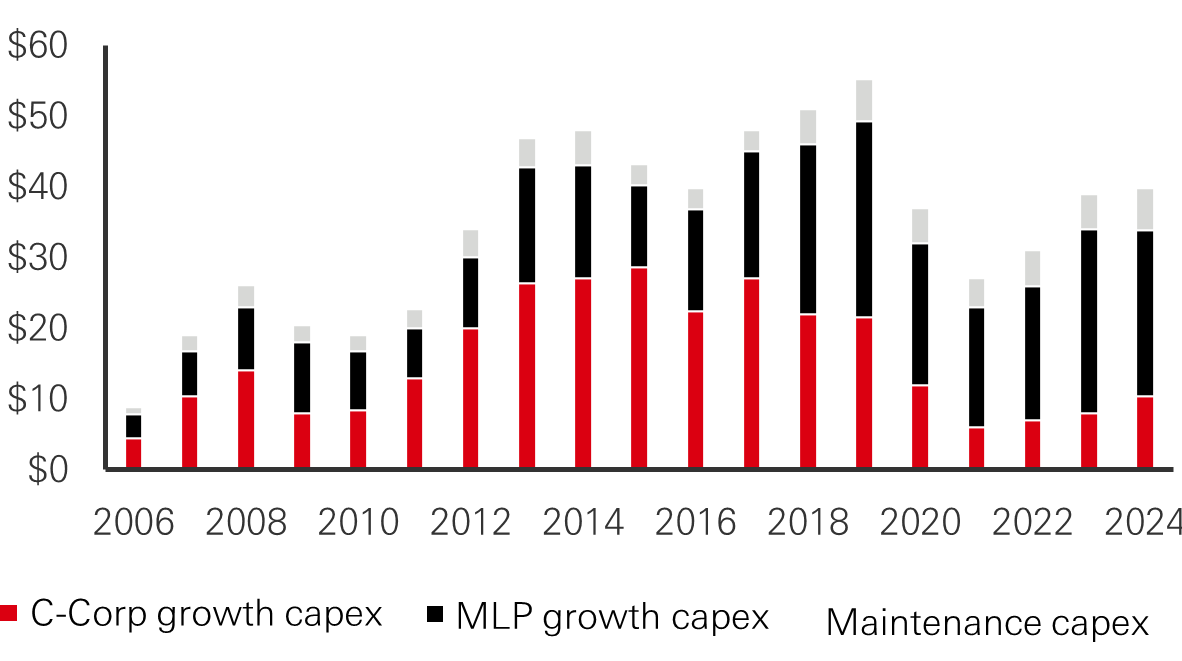
Source: Bloomberg, Wall Street research.
Considering the rise of environmental, social, and governance (“ESG”) factors and the transition to less carbon-intensive energy sources, investors began to express greater conservatism regarding terminal value risk. This shift forced an adjustment in capital allocation towards share repurchases, which increase equity investors’ residual claim on cash flows. Effectively, the sector shifted from a focus on rapid cash flow and distribution growth to a strategy emphasizing visible and above-average cash return through a combination of dividend yield, share repurchases, and deleveraging.
Impact on Business Risk
The transition of the midstream model towards self-funded organic growth, emphasizing lower capital expenditures on high-return projects and moderate payout ratios, has resulted in stronger balance sheets. This strategy involves generating sufficient cash flows to fund new projects rather than relying on external financing. A focused approach on high-return projects ensures selective investments, concentrating on opportunities that offer the best return for the least amount of risk. Moderate payout ratios, with companies returning a balanced portion of cash flows to shareholders while retaining enough to reinvest in the business, further support financial stability. Therefore, companies are less leveraged and can withstand market volatility.
This strategic shift has positively impacted the overall business risk of the sector. According to the trade-off theory of capital structure, while lower leverage has reduced the contribution of the debt tax shield to valuation, this has been counterbalanced by the benefit of lower perceived cost of financial distress. In practical terms, the sector’s levered beta (e.g. volatility) has decreased significantly, from a range of 1.2-1.4 during 2014-16 to a current range of 0.6-0.8. This reduction in levered beta implies asset betas lower than 0.50 today, almost comparable to those in the utilities sector (Fig. 9). The asset beta, also known as the unlevered beta, measures the risk of a company’s assets without considering the impact of debt. It reflects the systematic risk of the company’s underlying assets in relation to the overall market, providing a clear assessment of the risk associated with its core activities without the influence of the capital structure. A lower asset beta translates to more stable and predictable performance.
Figure 9: Levered and unlevered (asset) betas
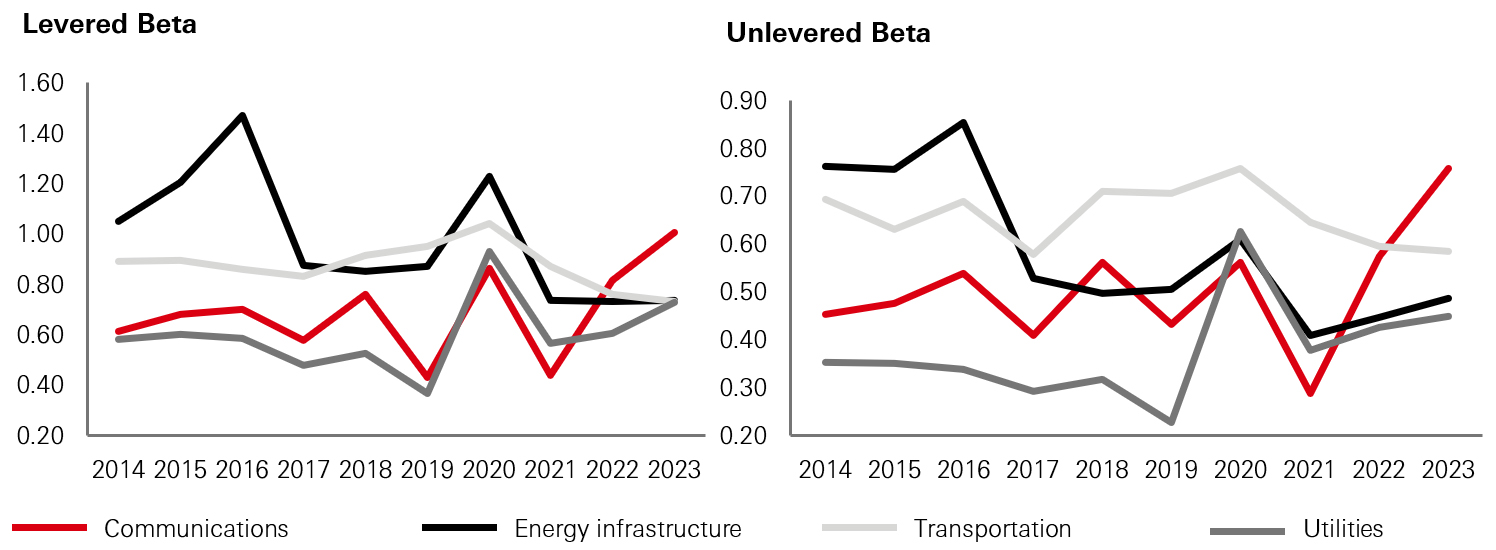
Source: Bloomberg
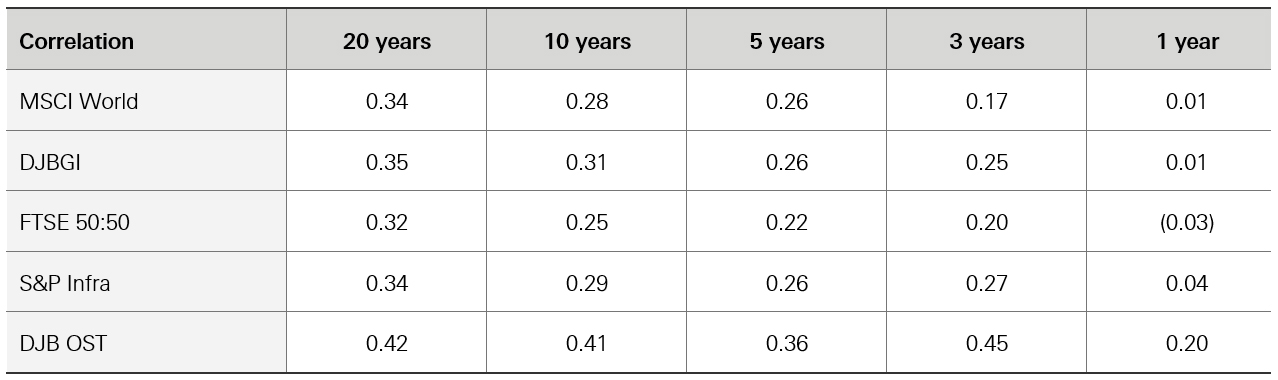
The reduction in business risk has contributed to stabilizing and even increasing valuation multiples for the sector. Moreover, the correlation with commodity prices has significantly decreased. This is because companies have become more selective about their projects, securing better contracts, and ensuring a higher contribution from take-or-pay agreements, which guarantee revenue regardless of actual usage and reduce the impact of fluctuating commodity prices on the companies’ financial performance.
Figure 10: Correlation with oil prices
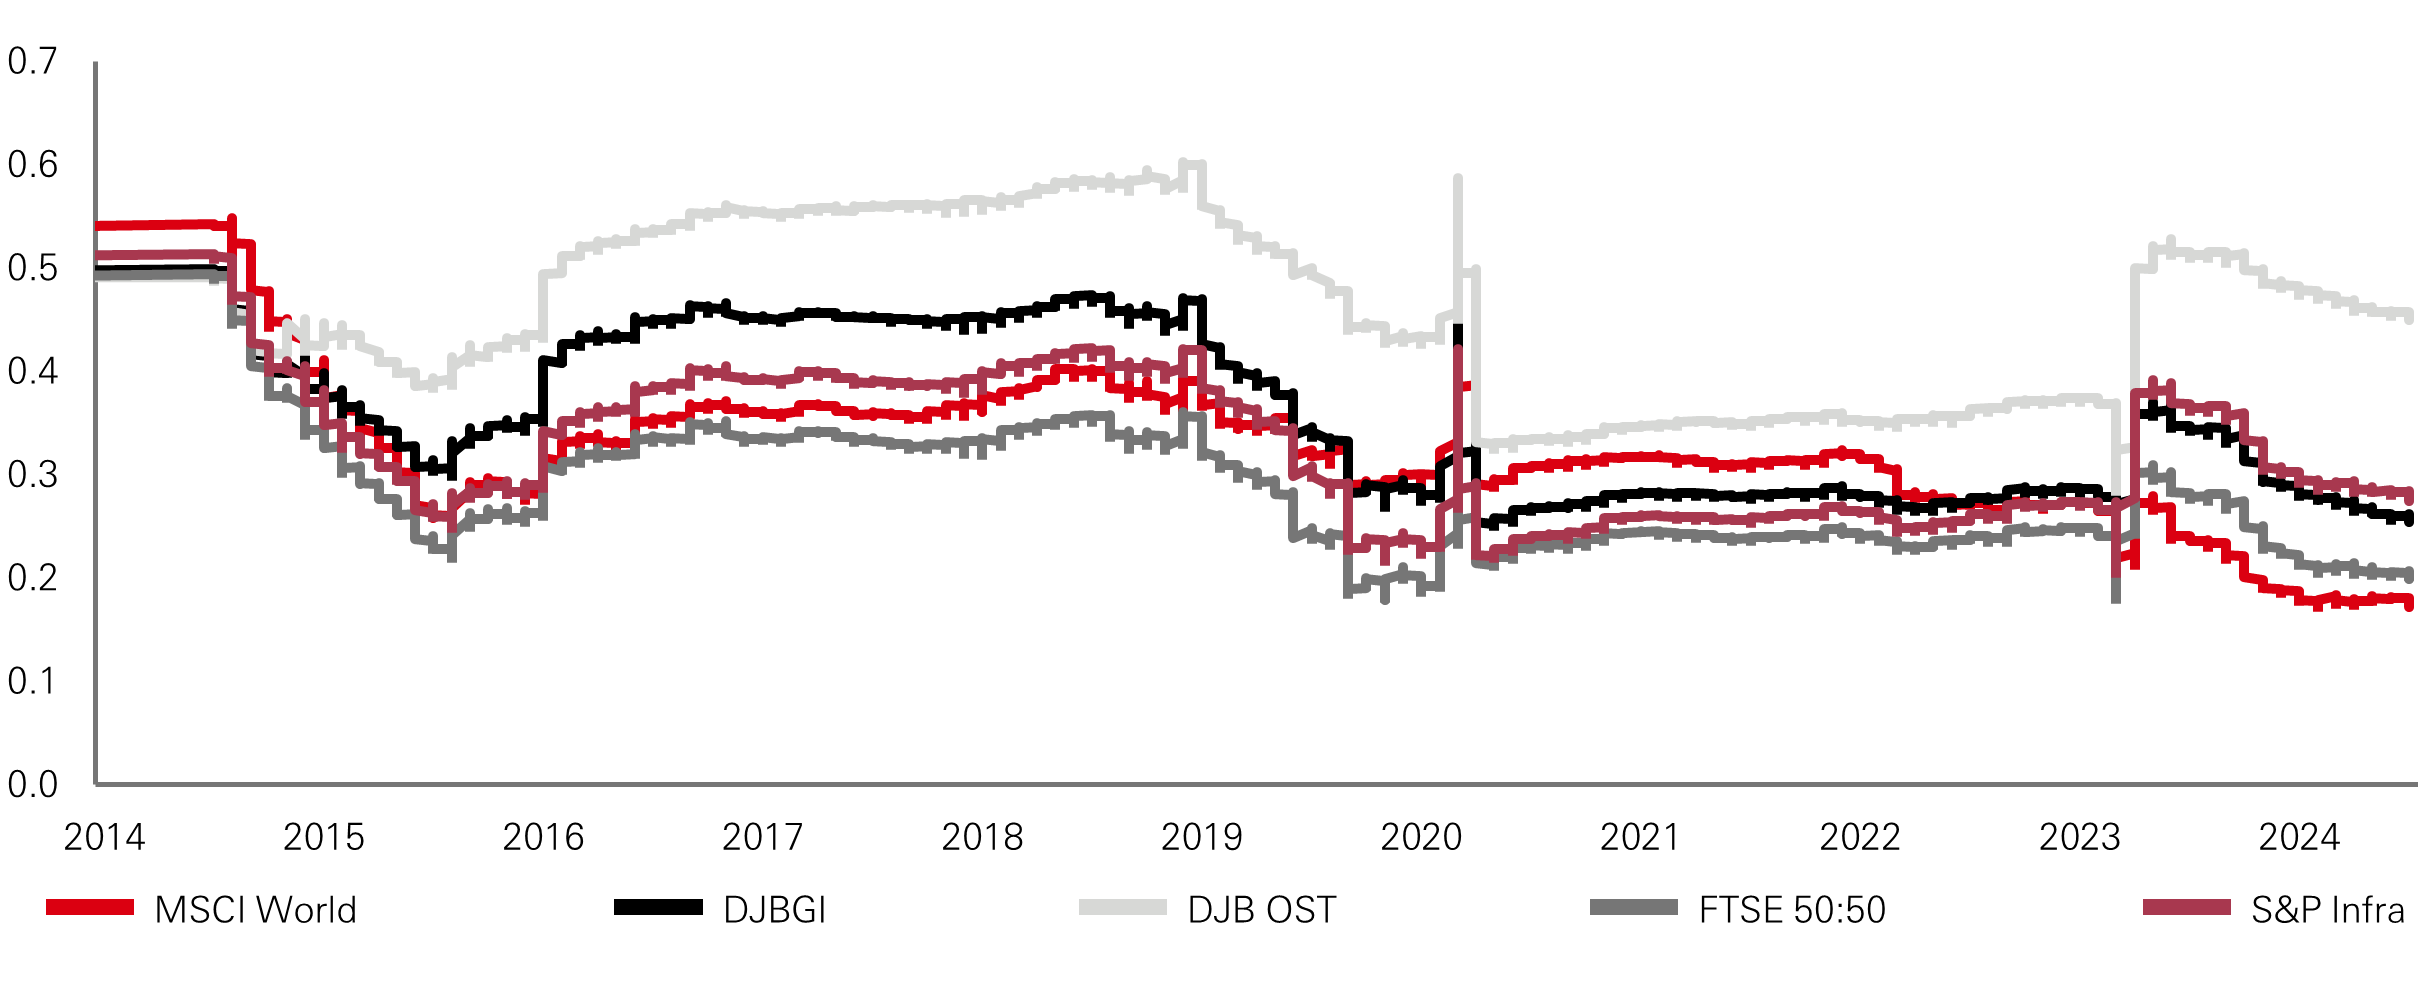
Source: Bloomberg
What is next for energy infrastructure
Several themes support the growth outlook for energy infrastructure, including LNG exports, growing demand for petrochemicals and NGLs, power demand from data centers and AI deployment, and emerging new technologies such as CCS.
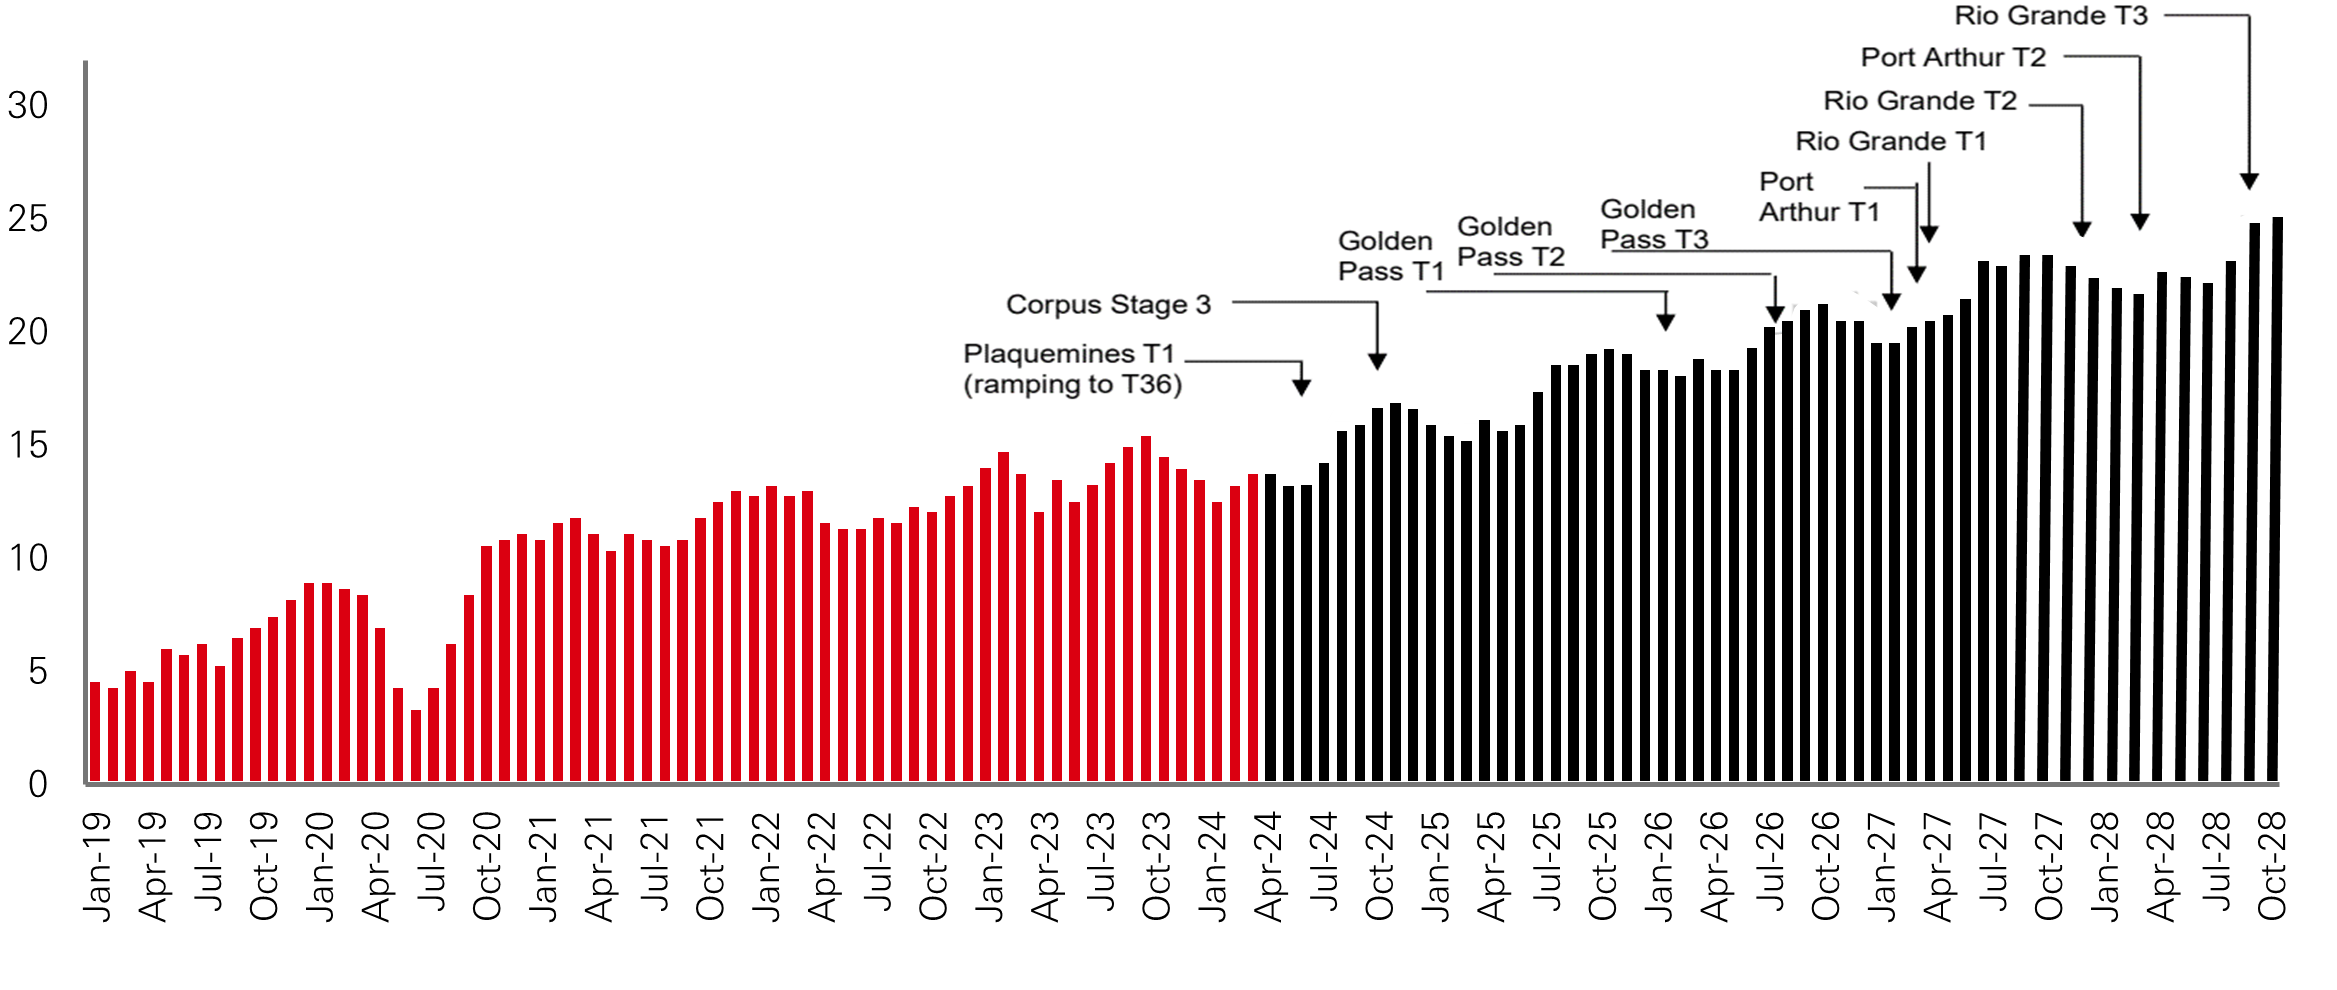
LNG Exports: The long-term demand for liquefied natural gas (LNG) exports continues to be a pivotal factor in shaping the energy infrastructure sector's outlook. The shift towards cleaner energy sources continues to support natural gas consumption, as it is perceived as a transition fuel that offers a balance between environmental considerations and energy security, as well as a backstop to intermittent renewable power generation. Emerging economies, particularly in Asia, increasingly rely on LNG to meet their growing energy demand while aiming to reduce coal dependency. As countries like China and India expand their LNG import infrastructure, US LNG exports are expected to grow (Fig. 11). This sustained demand, combined with geopolitical factors driving European countries to diversify their energy sources away from Russian supplies, underscores the strategic importance of long-term contracted midstream infrastructure to support cost-efficient and scalable LNG export/import solutions.
Figure 11: Feed gas into US liquefaction facilities (bcf/d)
Source: Wall Street research.
Growing Petrochemical and NGL Demand: The supply of NGLs remains crucial for the growing petrochemical industry, where demand is supported by rising income levels and growing population. NGLs represent the feedstock necessary for producing various petrochemicals such as ethylene, propylene, and butadiene. While substitutes and non-fossil fuel-dependent innovations may impact future demand, NGLs are the building blocks of modern society, used in clothing, tyres, packaging, detergents, healthcare, and other plastics. To support this demand, NGL pipelines, fractionation and storage facilities need to be scaled up to ensure reliable supply.
Figure 12: Petrochemical feedstock (mbpd)
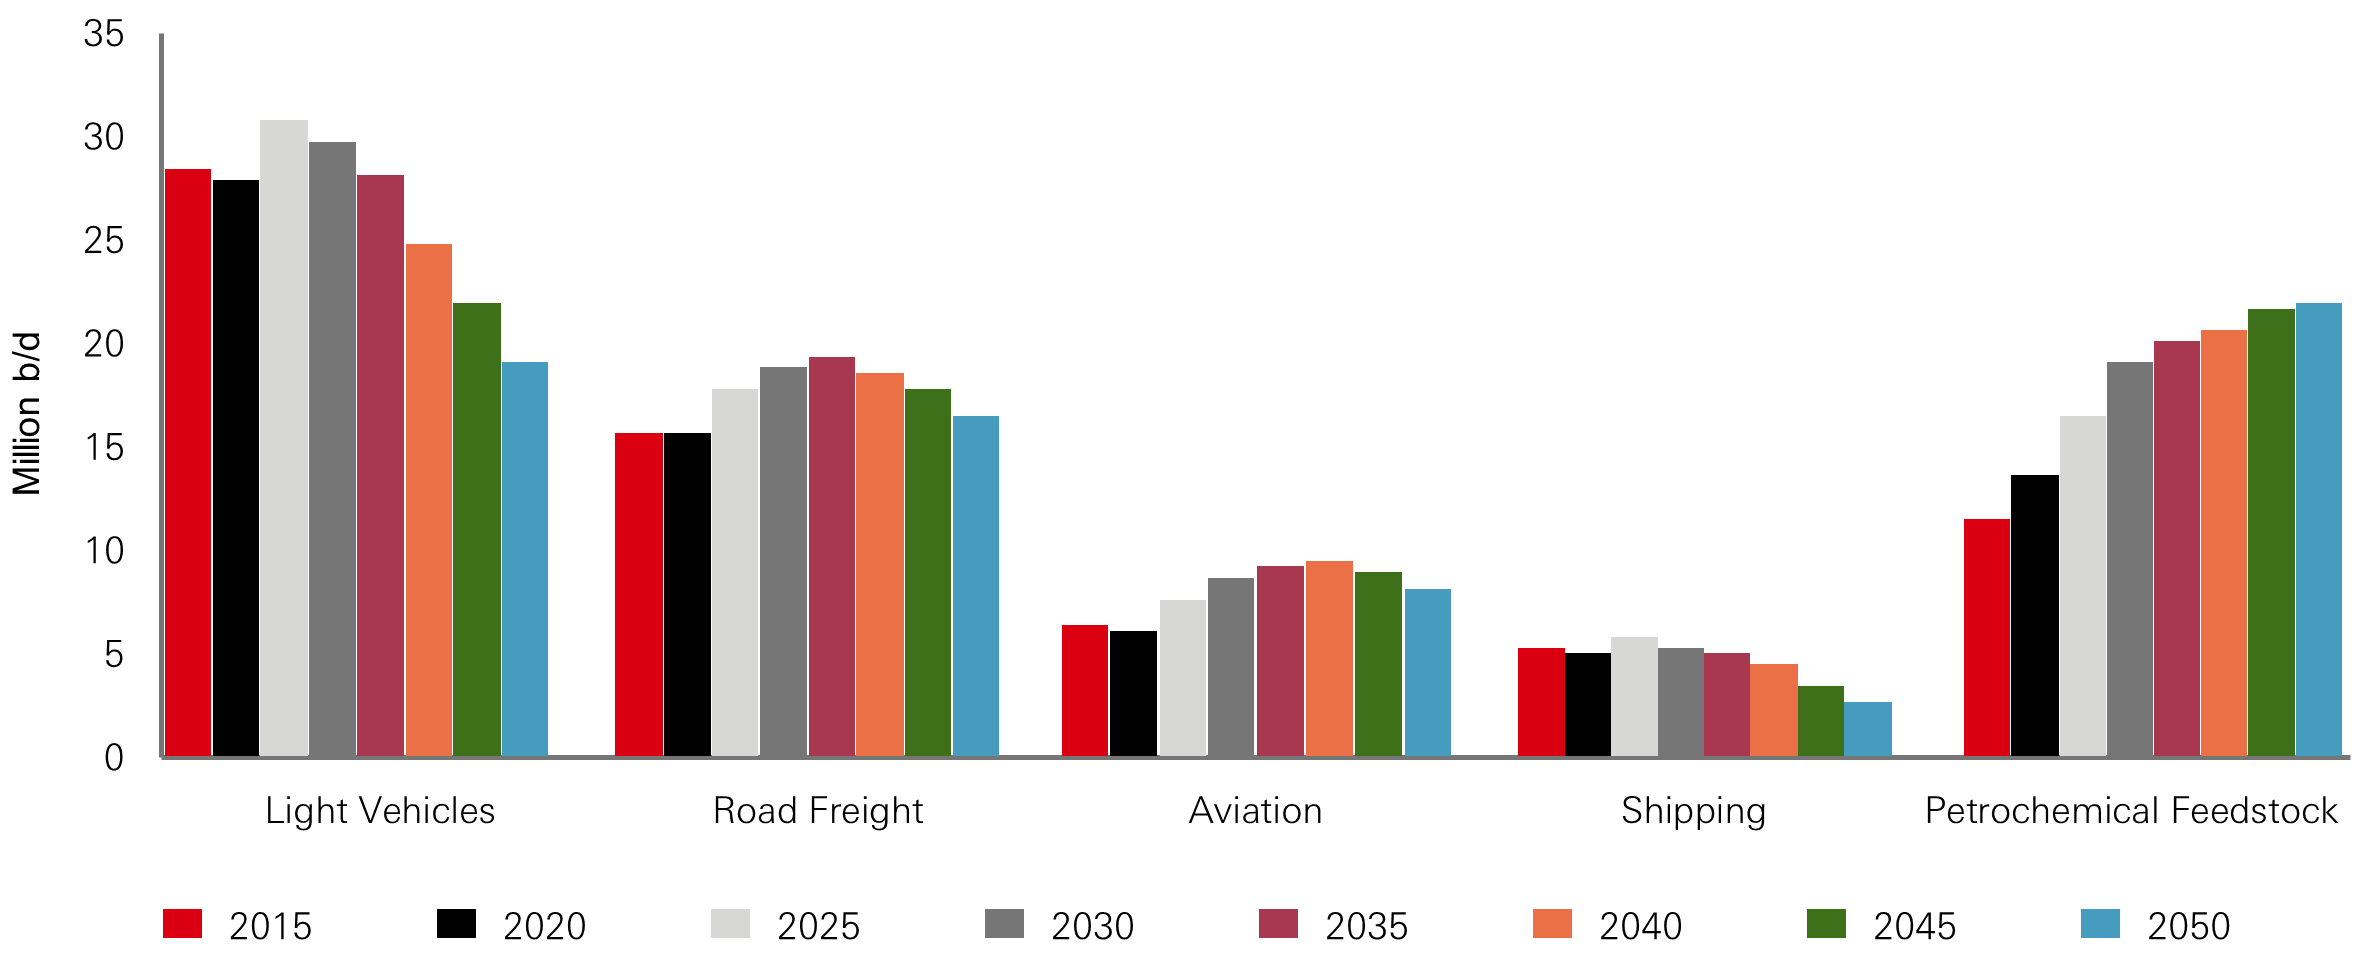
Source: Wood Mackenzie.
Power Load Growth from Data Centers and Supply Chain Re-onshoring: Data centers are expected to be the major driver of power demand growth, reaching ~10 per cent of total US power demand by 2030. Along with the electrification of all things and the re-onshoring of supply chains, power generation demand is expected to grow ~2 per cent per year through the end of the decade. Even with increased intermittent wind and solar power generation, natural gas power plants, which currently represent ~45 per cent of the power stack, will continue to play a critical role in ensuring a stable and reliable electricity supply, as more coal plants continue to shut down due to environmental and regulatory pressures.
Figure 13: Data center power demand
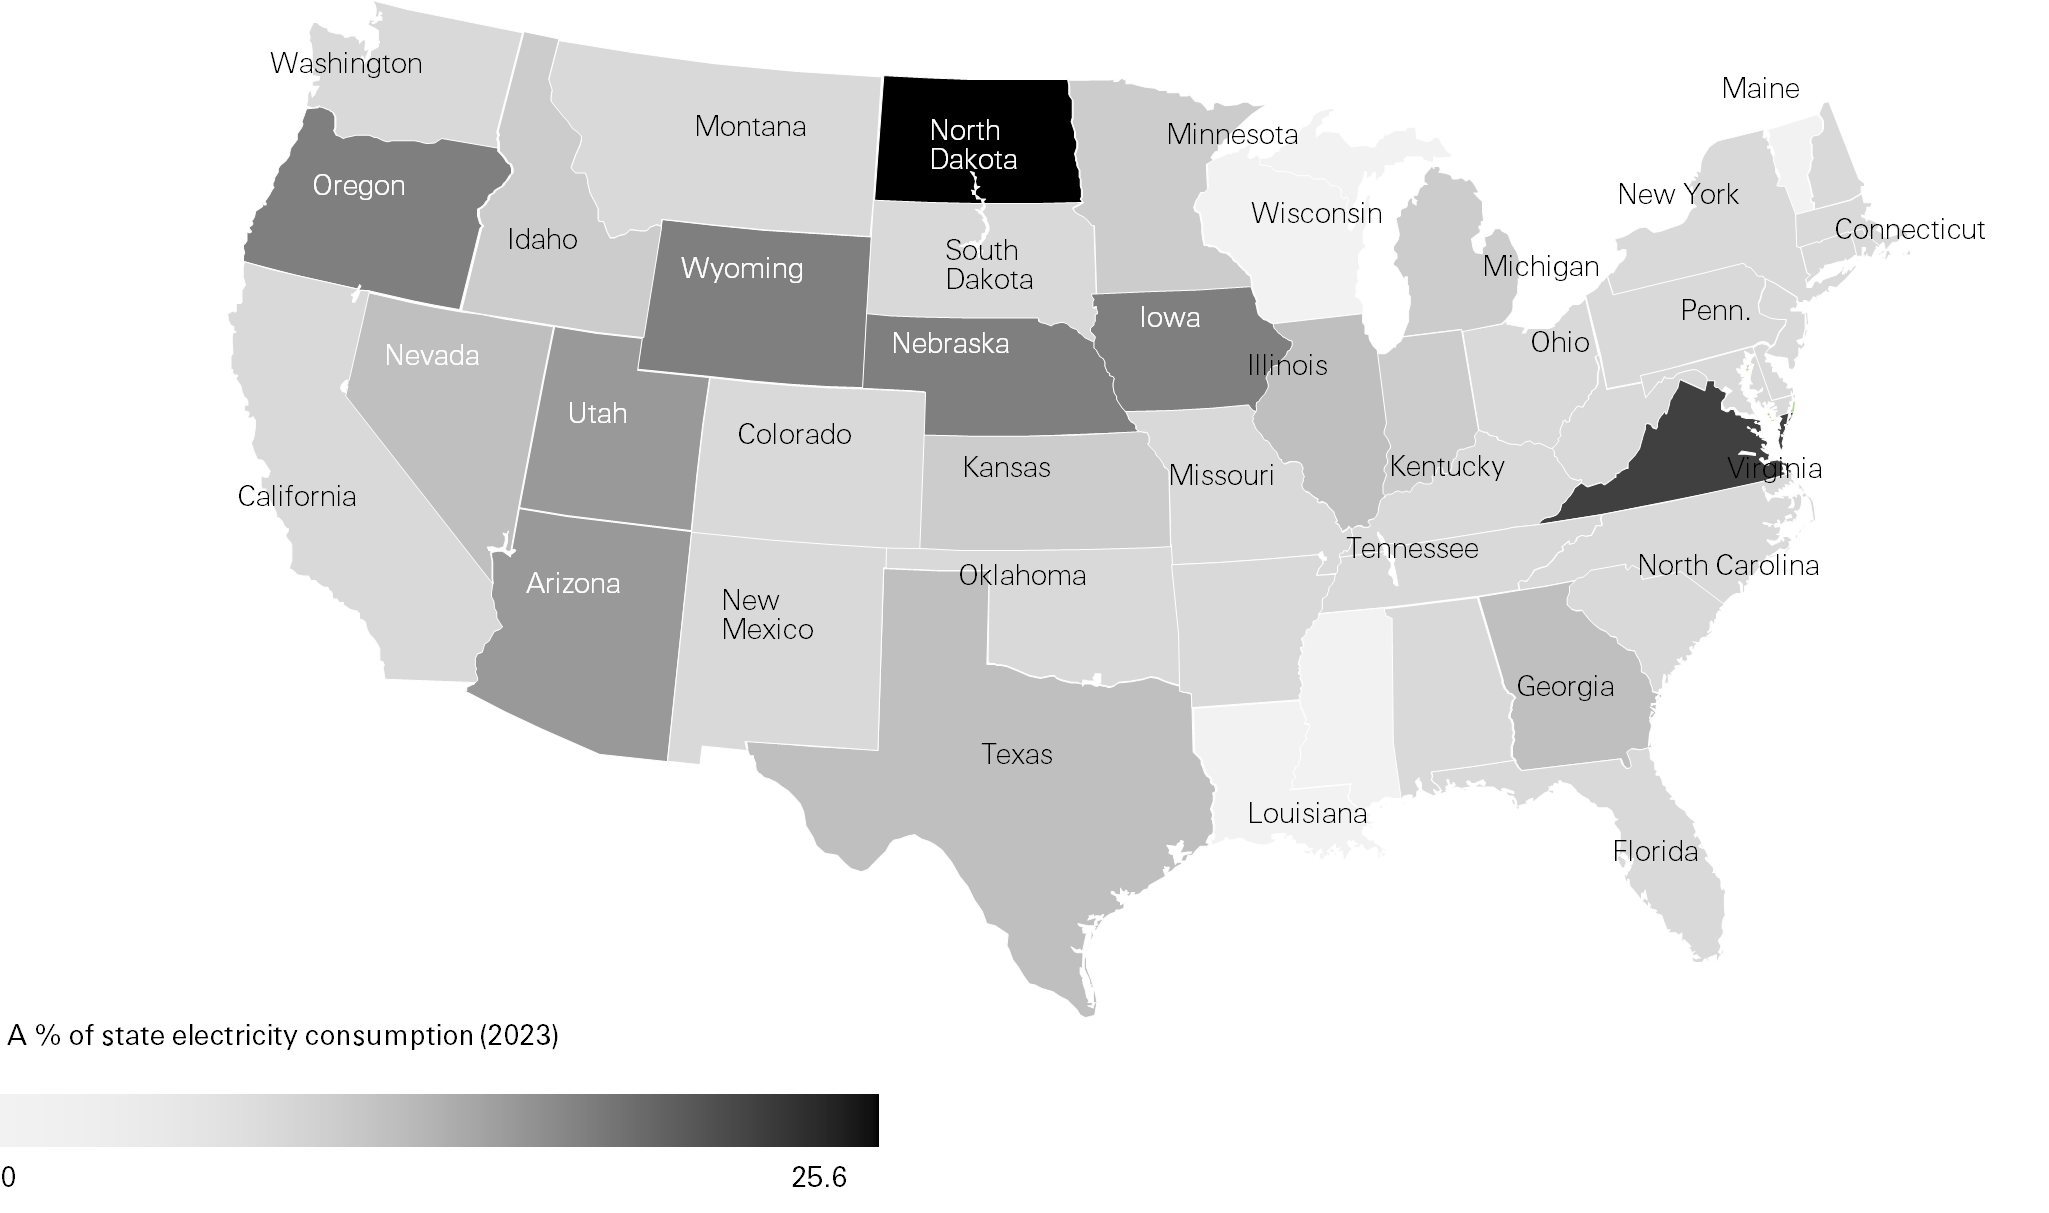
Source: EPRI and Wall Street research.
Carbon Capture and Storage: CCS is becoming an area of growing focus for energy infrastructure, seen as an enabler of the energy transition wherever pipelines can be repurposed for green uses and other emerging low-carbon opportunities, alleviating terminal value concerns. In fact, North America has many disused oil and gas wells that can be repurposed for CO2 injection. Once separated from other exhaust gases in industrial applications, the captured CO2 can be compressed and transported via pipelines to a storage site, where it is pumped and stored deep underground through injection (“Class VI”) wells. In August 2022, the US Congress passed the Inflation Reduction Act (“IRA”), which includes a set of renewable energy policies that increased the credit for sequestered CO2 to $85/ton. Unfortunately, initial investments were slowed down by the injection well approval process. The Environmental Protection Agency (“EPA”) recently granted Louisiana primacy in the permitting and regulation of injection wells. State primacy should accelerate the approval of the current list of projects - almost 50 – that are currently under review, and progressively increase industry confidence in the outlook for CCS investments as the first projects start construction.
Figure 14: Proposed carbon capture capacity (mn tons of CO2 per year)
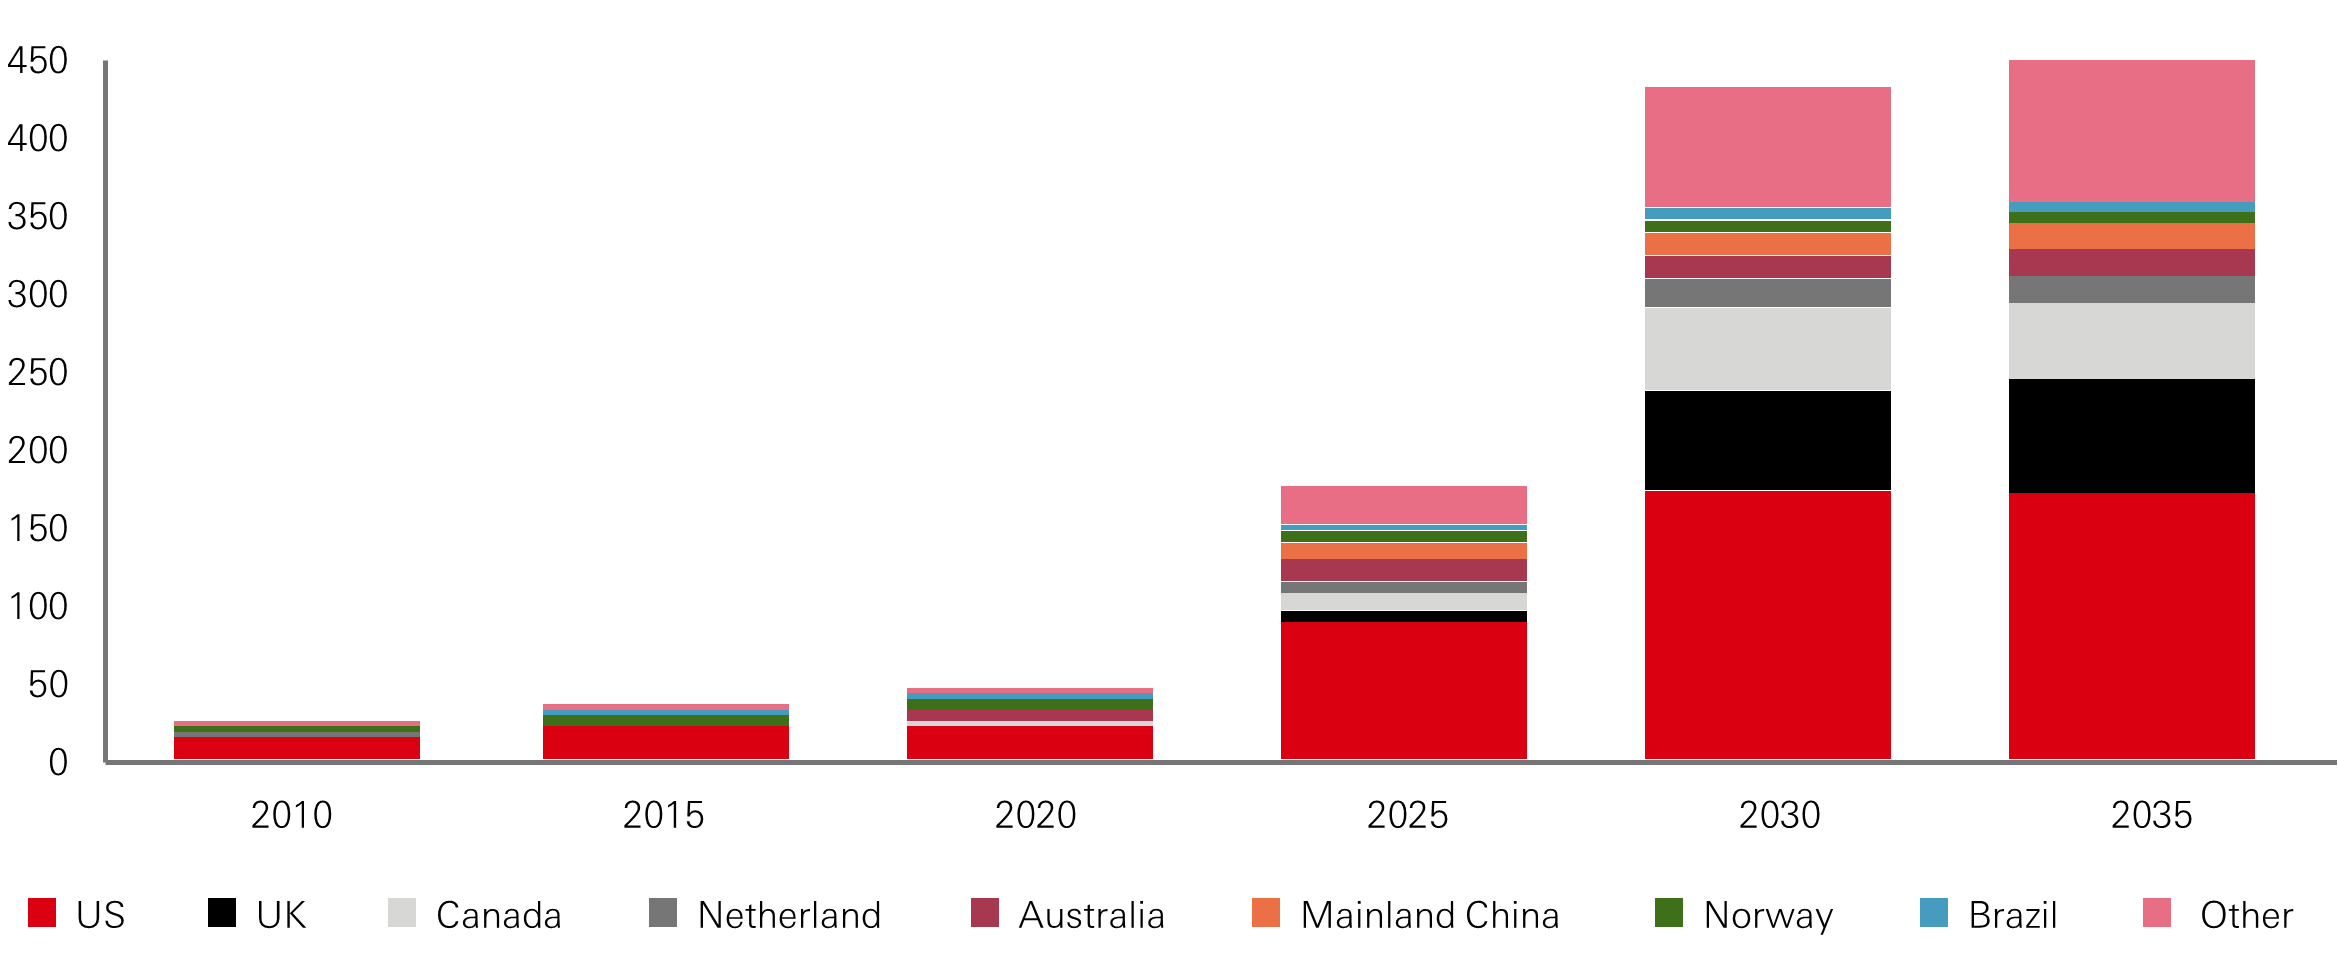
Source: BloombergNEF.
Energy infrastructure companies provide an essential service to society by building and operating critical assets that face high barriers to entry within a consolidating industry, often exhibiting monopolistic characteristics in many producing basins. Operating under long-term fee-based contracts, these companies benefit from stable, predictable, and growing cash flows that are increasingly insulated from commodity price volatility and economic cycles. Midstream assets also offer substantial diversification benefits within a listed infrastructure portfolio. Their cash flows are less sensitive to interest rate fluctuations compared to other segments of the asset class, ensuring a balanced generation of sustainable and predictable returns over the long term.
For more information contact:
| Giuseppe Corona Head of Listed Real Assets | HSBC Giuseppe.Corona@hsbc.com |
Jessica Nguy Investment Specialist | HSBC Jessica.Nguy@hsbc.com |
Please visit: HSBC Asset Management
Important information
For Professional Clients and intermediaries within countries and territories set out below, and for Institutional Investors and Financial Advisors in the US. This document should not be distributed to or relied upon by Retail clients/investors.
- The value of investments and the income from them can go down as well as up and investors may not get back the amount originally invested. The performance figures contained in this document relate to past performance, which should not be seen as an indication of future returns. Future returns will depend, inter alia, on market conditions, investment manager’s skill, risk level and fees. Where overseas investments are held the rate of currency exchange may cause the value of such investments to go down as well as up. Investments in emerging markets are by their nature higher risk and potentially more volatile than those inherent in some established markets. Economies in Emerging Markets generally are heavily dependent upon international trade and, accordingly, have been and may continue to be affected adversely by trade barriers, exchange controls, managed adjustments in relative currency values and other protectionist measures imposed or negotiated by the countries and territories with which they trade. These economies also have been and may continue to be affected adversely by economic conditions in the countries and territories in which they trade.
- The contents of this document may not be reproduced or further distributed to any person or entity, whether in whole or in part, for any purpose. All non-authorised reproduction or use of this document will be the responsibility of the user and may lead to legal proceedings. The material contained in this document is for general information purposes only and does not constitute advice or a recommendation to buy or sell investments. Some of the statements contained in this document may be considered forward looking statements which provide current expectations or forecasts of future events. Such forward looking statements are not guarantees of future performance or events and involve risks and uncertainties. Actual results may differ materially from those described in such forward-looking statements as a result of various factors. We do not undertake any obligation to update the forward-looking statements contained herein, or to update the reasons why actual results could differ from those projected in the forward-looking statements. This document has no contractual value and is not by any means intended as a solicitation, nor a recommendation for the purchase or sale of any financial instrument in any jurisdiction in which such an offer is not lawful. The views and opinions expressed herein are those of HSBC Asset Management at the time of preparation and are subject to change at any time. These views may not necessarily indicate current portfolios' composition. Individual portfolios managed by HSBC Asset Management primarily reflect individual clients' objectives, risk preferences, time horizon, and market liquidity. Foreign and emerging markets. Investments in foreign markets involve risks such as currency rate fluctuations, potential differences in accounting and taxation policies, as well as possible political, economic, and market risks. These risks are heightened for investments in emerging markets which are also subject to greater illiquidity and volatility than developed foreign markets. This commentary is for information purposes only. It is a marketing communication and does not constitute investment advice or a recommendation to any reader of this content to buy or sell investments nor should it be regarded as investment research. It has not been prepared in accordance with legal requirements designed to promote the independence of investment research and is not subject to any prohibition on dealing ahead of its dissemination. This document is not contractually binding nor are we required to provide this to you by any legislative provision.
- All data from HSBC Asset Management unless otherwise specified. Any third-party information has been obtained from sources we believe to be reliable, but which we have not independently verified.
- HSBC Asset Management is the brand name for the asset management business of HSBC Group, which includes the investment activities that may be provided through our local regulated entities. HSBC Asset Management is a group of companies in many countries and territories throughout the world that are engaged in investment advisory and fund management activities, which are ultimately owned by HSBC Holdings Plc. (HSBC Group). The above communication is distributed by the following entities:
- In Argentina by HSBC Global Asset Management Argentina S.A., Sociedad Gerente de Fondos Comunes de Inversión, Agente de administración de productos de inversión colectiva de FCI N°1;
- In Australia, this document is issued by HSBC Bank Australia Limited ABN 48 006 434 162, AFSL 232595, for HSBC Global Asset Management (Hong Kong) Limited ARBN 132 834 149 and HSBC Global Asset Management (UK) Limited ARBN 633 929 718. This document is for institutional investors only and is not available for distribution to retail clients (as defined under the Corporations Act). HSBC Global Asset Management (Hong Kong) Limited and HSBC Global Asset Management (UK) Limited are exempt from the requirement to hold an Australian financial services license under the Corporations Act in respect of the financial services they provide. HSBC Global Asset Management (Hong Kong) Limited is regulated by the Securities and Futures Commission of Hong Kong under the Hong Kong laws, which differ from Australian laws. HSBC Global Asset Management (UK) Limited is regulated by the Financial Conduct Authority of the United Kingdom and, for the avoidance of doubt, includes the Financial Services Authority of the United Kingdom as it was previously known before 1 April 2013, under the laws of the United Kingdom, which differ from Australian laws;
- in Bermuda by HSBC Global Asset Management (Bermuda) Limited, of 37 Front Street, Hamilton, Bermuda which is licensed to conduct investment business by the Bermuda Monetary Authority;
- in Chile: Operations by HSBC's headquarters or other offices of this bank located abroad are not subject to Chilean inspections or regulations and are not covered by warranty of the Chilean state. Further information may be obtained about the state guarantee to deposits at your bank or on www.sbif.cl;
- in Colombia: HSBC Bank USA NA has an authorized representative by the Superintendencia Financiera de Colombia (SFC) whereby its activities conform to the General Legal Financial System. SFC has not reviewed the information provided to the investor. This document is for the exclusive use of institutional investors in Colombia and is not for public distribution;
- in Finland, Norway, Denmark and Sweden by HSBC Global Asset Management (France), a Portfolio Management Company authorised by the French regulatory authority AMF (no. GP99026) and through the Stockholm branch of HSBC Global Asset Management (France), regulated by the Swedish Financial Supervisory Authority (Finansinspektionen);
- in France, Belgium, Netherlands, Luxembourg, Portugal, Greece by HSBC Global Asset Management (France), a Portfolio Management Company authorised by the French regulatory authority AMF (no. GP99026);
- in Germany by HSBC Global Asset Management (Deutschland) GmbH which is regulated by BaFin (German clients) respective by the Austrian Financial Market Supervision FMA (Austrian clients);
- in Hong Kong by HSBC Global Asset Management (Hong Kong) Limited, which is regulated by the Securities and Futures Commission. This video/content has not be reviewed by the Securities and Futures Commission;
- in India by HSBC Asset Management (India) Pvt Ltd. which is regulated by the Securities and Exchange Board of India;
- in Italy and Spain by HSBC Global Asset Management (France), a Portfolio Management Company authorised by the French regulatory authority AMF (no. GP99026) and through the Italian and Spanish branches of HSBC Global Asset Management (France), regulated respectively by Banca d’Italia and Commissione Nazionale per le Società e la Borsa (Consob) in Italy, and the Comisión Nacional del Mercado de Valores (CNMV) in Spain;
- in Malta by HSBC Global Asset Management (Malta) Limited which is regulated and licensed to conduct Investment Services by the Malta Financial Services Authority under the Investment Services Act;
- in Mexico by HSBC Global Asset Management (Mexico), SA de CV, Sociedad Operadora de Fondos de Inversión, Grupo Financiero HSBC which is regulated by Comisión Nacional Bancaria y de Valores;
- in the United Arab Emirates, Qatar, Bahrain & Kuwait by HSBC Global Asset Management MENA, a unit within HSBC Bank Middle East Limited, U.A.E Branch, PO Box 66 Dubai, UAE, regulated by the Central Bank of the U.A.E. and the Securities and Commodities Authority in the UAE under SCA license number 602004 for the purpose of this promotion and lead regulated by the Dubai Financial Services Authority. HSBC Bank Middle East Limited is a member of the HSBC Group and HSBC Global Asset Management MENA are marketing the relevant product only in a sub-distributing capacity on a principal-to-principal basis. HSBC Global Asset Management MENA may not be licensed under the laws of the recipient’s country of residence and therefore may not be subject to supervision of the local regulator in the recipient’s country of residence. One of more of the products and services of the manufacturer may not have been approved by or registered with the local regulator and the assets may be booked outside of the recipient’s country of residence.
- in Peru: HSBC Bank USA NA has an authorized representative by the Superintendencia de Banca y Seguros in Perú whereby its activities conform to the General Legal Financial System - Law No. 26702. Funds have not been registered before the Superintendencia del Mercado de Valores (SMV) and are being placed by means of a private offer. SMV has not reviewed the information provided to the investor. This document is for the exclusive use of institutional investors in Perú and is not for public distribution;
- in Singapore by HSBC Global Asset Management (Singapore) Limited, which is regulated by the Monetary Authority of Singapore. The content in the document/video has not been reviewed by the Monetary Authority of Singapore;
- in Switzerland by HSBC Global Asset Management (Switzerland) AG. This document is intended for professional investor use only. For opting in and opting out according to FinSA, please refer to our website; if you wish to change your client categorization, please inform us. HSBC Global Asset Management (Switzerland) AG having its registered office at Gartenstrasse 26, PO Box, CH-8002 Zurich has a licence as an asset manager of collective investment schemes and as a representative of foreign collective investment schemes. Disputes regarding legal claims between the Client and HSBC Global Asset Management (Switzerland) AG can be settled by an ombudsman in mediation proceedings. HSBC Global Asset Management (Switzerland) AG is affiliated to the ombudsman FINOS having its registered address at Talstrasse 20, 8001 Zurich. There are general risks associated with financial instruments, please refer to the Swiss Banking Association (“SBA”) Brochure “Risks Involved in Trading in Financial Instruments”;
- in Taiwan by HSBC Global Asset Management (Taiwan) Limited which is regulated by the Financial Supervisory Commission R.O.C. (Taiwan);
- in the UK by HSBC Global Asset Management (UK) Limited, which is authorised and regulated by the Financial Conduct Authority;
- and in the US by HSBC Global Asset Management (USA) Inc. which is an investment adviser registered with the US Securities and Exchange Commission.
- In Uruguay, operations by HSBC's headquarters or other offices of this bank located abroad are not subject to Uruguayan inspections or regulations and are not covered by warranty of the Uruguayan state. Further information may be obtained about the state guarantee to deposits at your bank or on www.bcu.gub.uy.
NOT FDIC INSURED ◆ NO BANK GUARANTEE ◆ MAY LOSE VALUE
Copyright © HSBC Global Asset Management Limited 2024. All rights reserved. No part of this publication may be reproduced, stored in a retrieval system, or transmitted, on any form or by any means, electronic, mechanical, photocopying, recording, or otherwise, without the prior written permission of HSBC Global Asset Management Limited.