
Blueprints for enduring value
Today’s global investment landscape has rarely been more complex and changeable. Geopolitical realignment, trade tensions, and other policy shocks, are combining with AI, the energy transition, and other disruptive forces to create a volatile investment environment.
In these conditions, the benefits of patient capital are clear. Rather than passively react to volatility, investors need a blueprint for growing and future-proofing their portfolio. Private equity allows investors to achieve long-term resilience through active ownership, disciplined governance, and the ability to create enduring businesses across market cycles.Private equity managers are like skilled architects who plan strategically, construct systematically, and build to endure. This paper explores why the time-tested traditional closed-ended model of private equity can potentially deliver robust value creation for investors.
Back to basics
Understanding the traditional private equity model
A traditional closed-ended drawdown fund has a fixed lifetime of around 10-12 years. Investors (limited partners, or LPs) commit capital at the outset, which is then ‘drawn down’ periodically as the private equity manager (general partner, or GP) identifies attractive investment opportunities. The GP works closely with acquired portfolio companies to enhance performance. Over time, the expectation is that these improvements translate into more durable cashflows and higher valuations.
As the portfolio matures, the GP seeks to realise investments, commonly through trade sales, M&As, IPOs, or secondary buyouts. The proceeds from such sales are distributed back to LPs and the expectation is that LPs recycle some or all distributions into new fund vintages. Early outflows and delayed inflows create the familiar J-curve pattern of returns as negative cashflows in the early years are offset by rising distributions and as investments mature.
Figure 1: Private equity J-curve pattern of returns
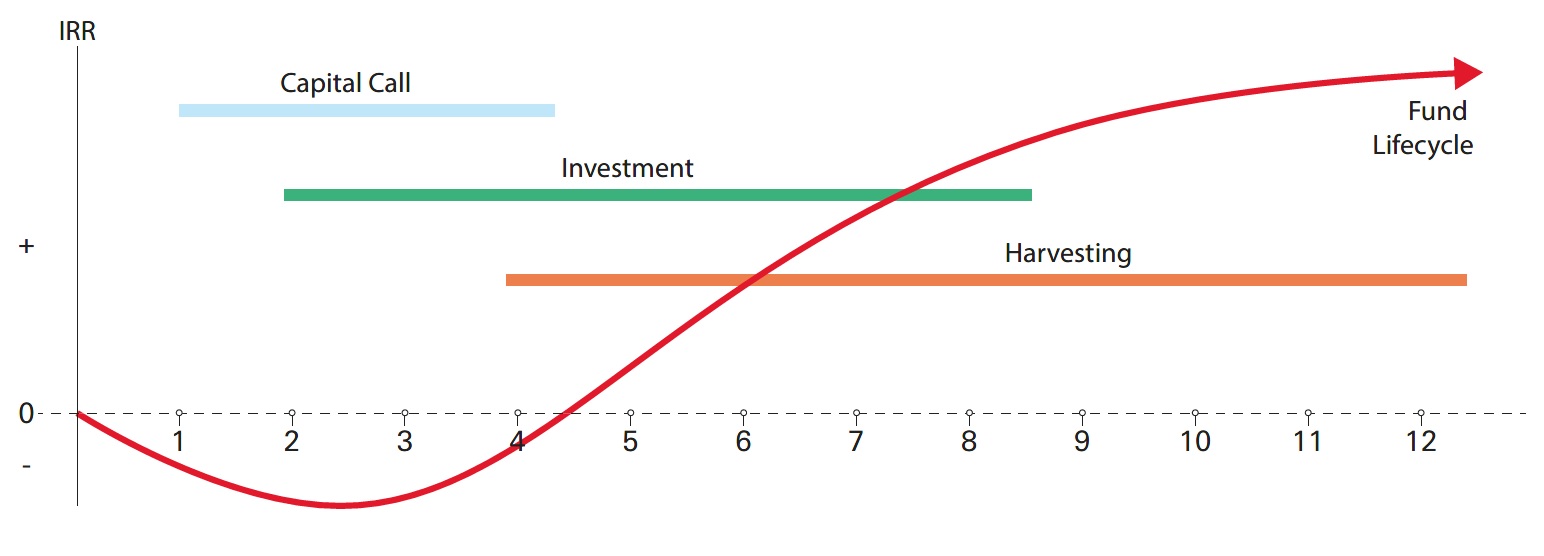
Source: HSBC Asset Management (2025)
This model explicitly separates long-term value creation from market volatility and rewards patience, discipline, and active ownership. These are the hallmarks of private equity’s enduring performance advantage.
How do private equity managers generate value?
Private equity managers have a variety of ways to create value among their portfolio companies.
- Revenue growth: GPs have different levers to grow revenues, including fund a company’s expansion, restructuring management, improving operations, and pursuing strategic growth initiatives, like entering new markets or making acquisitions
- Multiple expansion: GPs can sell a company at a higher valuation multiple than they bought it for. This is possible if the GP can increase margins and revenue, professionalise operations, acquire attractive companies, or exit investments under favourable conditions
- Margin expansion: GPs can boost earnings EBITDA through improving operational efficiency, cost reduction, and increasing productivity by automating processes with AI, for instance. Margin expansion can also be achieved through enhancing revenues via strategic pricing, sales performance management, improving procurement, and acquiring companies to create synergies
Research reveals that over the last decade, private equity buyout funds, on average, have largely ignored margin growth as a driver of value and have focused on multiple expansion 1.
Figure 2: Median indexed value creation drivers for global buyouts (Deal entry years 2013 – 2023)
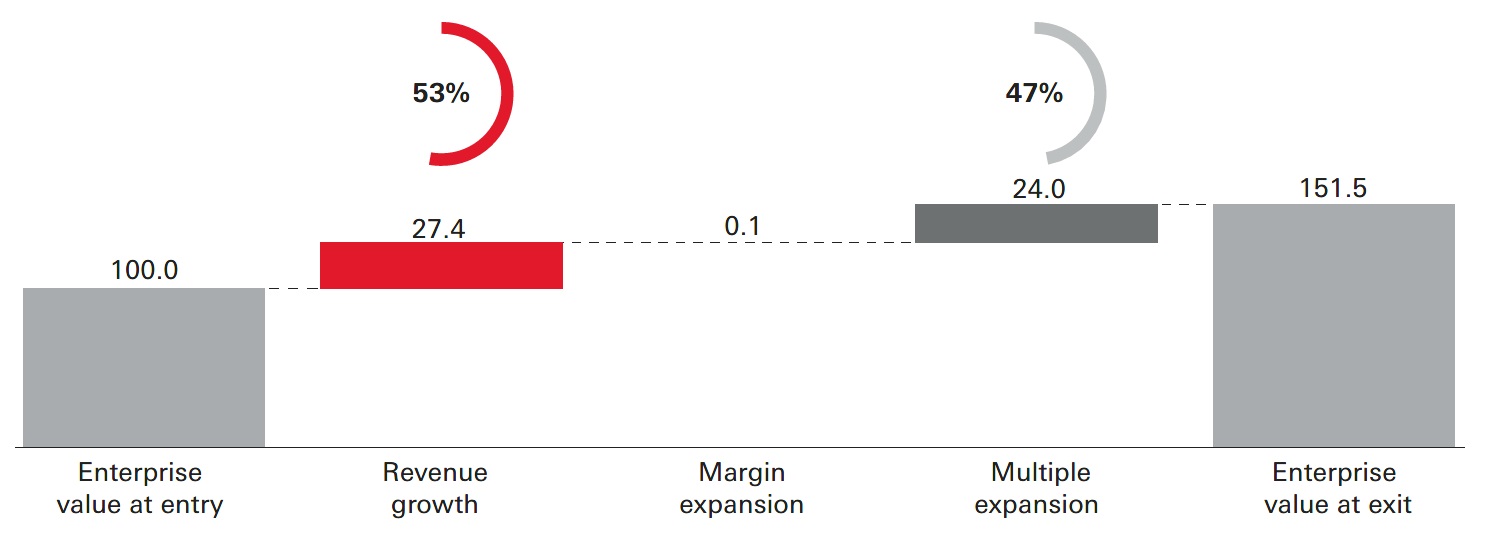
Notes: Indexed to enterprise value at entry; includes fully and partially realised global buyout deals by year of entry; includes deals with invested equity capital of USD 50mn or more; excludes real estate; all figures US dollars.
Sources: DealEdge powered by CEPRES data. Bain analysis.
Source: Bain Capital (2025)
As the chart above shows, for global buyout funds in the decade to 2023, revenue growth contributed to 53 per cent of value creation, multiple expansion contributed 47 per cent, and margin expansion the very small remainder.
However, when focusing on the top-quartile buyout deals, we see a different mix. While multiple expansion represents half the upward movement in the enterprise value of their portfolio companies, margin improvement plays a significantly larger role than it does for the average fund.
Figure 3: Median indexed value creation drivers for global buyouts, by quartile performance (Deal entry years 2013 – 2023)
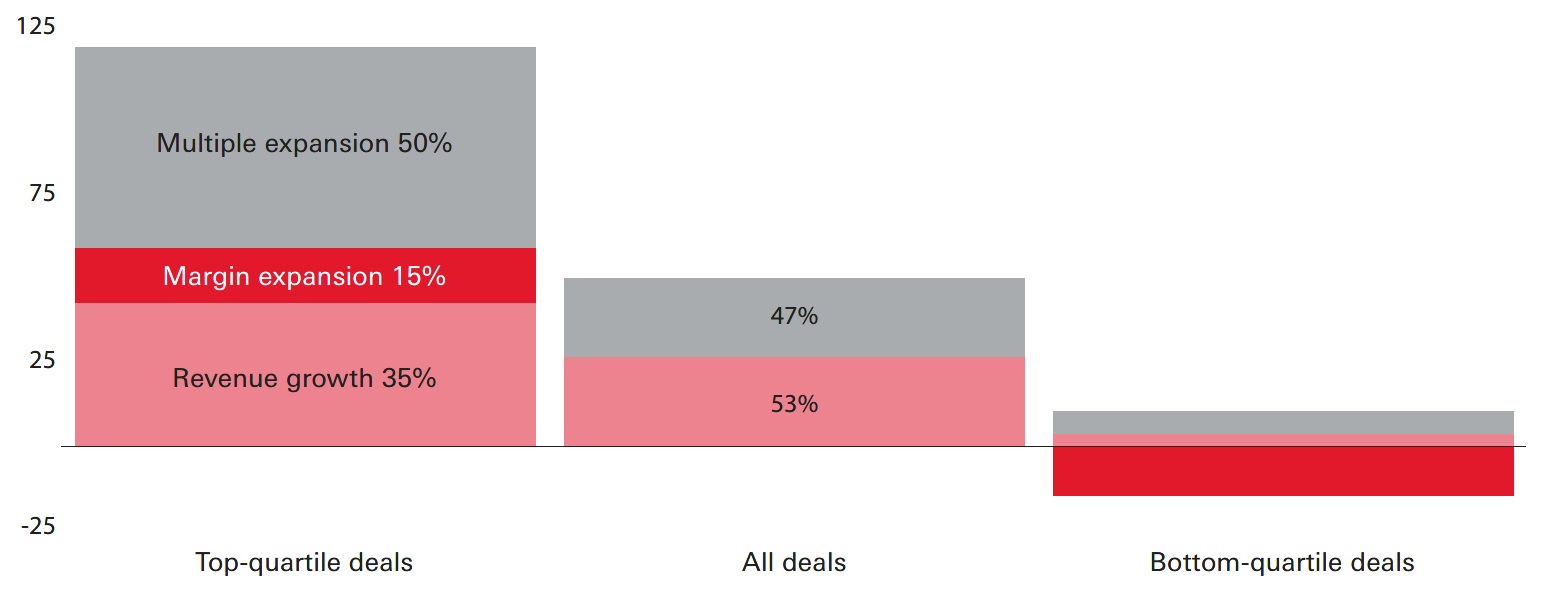
Notes: Top and bottom quartile deals by internal rate of return; top and bottom quartiles include only deals with IRR data available; includes fully and partially realised global buyout deals by year of entry; includes deals with invested equity capital of USD 50mn or more; excludes real estate; all figures US dollars. Sources: DealEdge powered by CEPRES data. Bain analysis.
Source: Bain Capital (2025)
The implication is that to drive future performance, GPs may need value-creation strategies that both boost revenue and margins. LPs that align with GPs that can generate on operational improvements amid a challenging macroeconomic and geopolitical environment will be rewarded. This is particularly important if interest rates remain elevated as the multiple expansion that has fuelled buyout returns over the past decade will be more challenged.
Why invest in private equity?
The traditional closed-ended drawdown model offers several unique benefits for investors.
Long-term discipline
Just as a well-built structure is built over months or years, a differentiated and diversified private equity portfolio takes time to construct. Architects have a clear blueprint, source materials carefully, ensure foundations are robust, and test each stage of construction meticulously. Similarly, private equity managers have a clear plan for value creation, conducting careful due diligence and market research to methodically deploy capital in high-conviction opportunities over a fixed timeline. This leads to the construction of a portfolio of robust value-generative assets that can usually be exited in 10-12 years.
The advantage of a long-term disciplined approach is that there is no redemption pressure. GPs have the time and freedom to improve businesses away from persistent short-term market scrutiny. GPs can thus ride the cycle and sell into strength, supporting sustainable value creation and returns, as measured by IRR 2, and TVPI 3 or MOIC 4.
This is important when markets are challenged when public market investors can be forced sellers. For example, amid tariff-related volatility in 2025, GPs were able to focus on long-term operational value creation and positioning companies for growth.
Governance and control
Just as a structure is built to last using sound engineering and robust foundations, in private equity, strong governance is instrumental to building company resilience.
Unlike investment in public companies which confer only minority shareholder rights, closed-ended funds usually have direct control over key decisions, such as guiding strategy, selecting management teams, and rationalising costs. These governance rights underpin the GP’s ability to make bold decisions and are the mechanisms through which company transformation can occur.
Strong governance is also key to understanding, monitoring, and managing risks. For example, the way a GP structures covenants will impact a company’s leverage and debt sustainability, helping to support equity valuations.
In 2025, many GPs implemented value creation programmes to rebuild margins through digital transformation and capital allocation decisions. This was enabled by GPs having strong governance and direct control over company strategy.
Close alignment of interests
The fee structure of a traditional private equity fund consists of a management fee (typically 1 per cent-2.5 per cent of committed capital or NAV) and a performance fee, also known as carried interest. Just as an architect is often paid in instalments as phases of a building are completed, GPs are paid carried interest based on surpassing certain milestones.
Carried interest, is usually charged only if the fund returns all capital contributions and then achieves a certain preferred return, or hurdle rate. The hurdle rate is commonly around 6-8 per cent compounded annually. Some funds will also have a look-back or clawback provision, which ensures that the GP does not receive more than its agreed percentage of carried interest over the life of the fund.
The visual below highlights a typical private equity fund fee structure.
Figure 4: Private equity waterfall return of profits
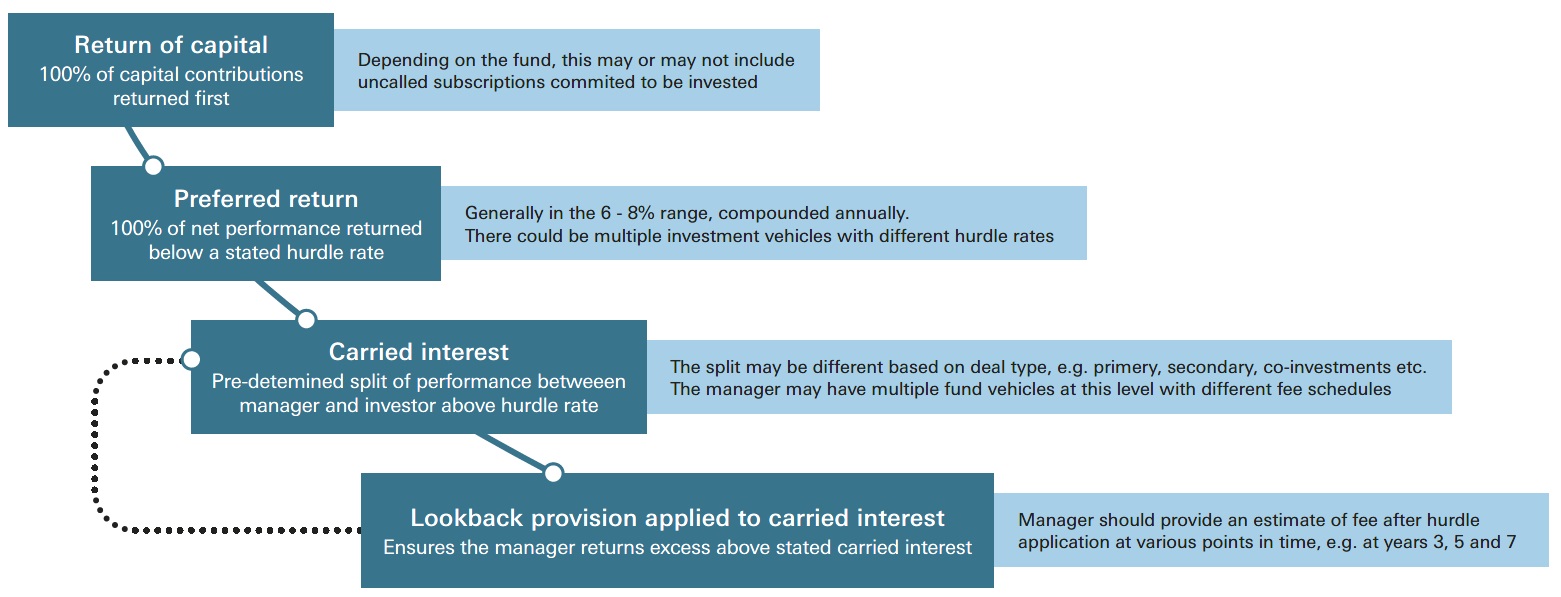
Source: FineMark (2025)
The presence of carried interest ensures close alignment of interests between GPs and LPs because it incentivises GPs to focus on value maximisation.
A further way a GP can signal strong alignment of incentives is to invest significant amounts of their own assets into their funds alongside their LPs. A typical investment is 1-5 per cent of the total fund’s assets.
Cashflow predictability
As we saw earlier, traditional drawdown fund returns typically follow a J-curve pattern, with initial negative returns as capital is called turning positive as value is created, and companies are exited over time.
The Limited Partner Agreement 5 (LPA) between the LP and GP sets out key terms, including the expected life of the fund, and a schedule of capital calls, exits, and distributions. This provides LPs with transparency and predictability of cashflows. The drawdown process ensures capital is only called when needed to invest in attractive deals, helping to minimise cash drag, thus supporting IRR.
Enabling close matching of cash flows to deal flow is particularly important when deal flow is inconsistent, as happened in 2025 in the wake of US tariffs. This contrasts with evergreen private equity strategies, where managers must maintain a steady flow of deals to deploy cash. If evergreen managers struggle to find and execute on deals, then the fund’s liquidity sleeves can increase and become a cash drag 6.
The predictability of exits and distributions is another feature of the drawdown model. After a period since the COVID pandemic, which saw a bottleneck in private equity exits and holding periods being extended, traditional exit routes are steadily opening. Strategic purchases, trade sales, M&A, and IPO markets are picking up, as macroeconomic and geopolitical uncertainty wanes and interest rates are cut.
The rapid growth and evolution of the secondaries market, particularly GP-led continuation vehicles are also helping to provide an important exit route. In a secondary fund, the buyer acquires existing ownership stakes in private companies or private equity funds. Secondaries can provide sellers with earlier liquidity and quicker exits as the assets are more mature.
In summary, the cashflow profile of private equity is integral to the ability of managers to create long-term value, while also managing risk and liquidity.
Access to the huge private market opportunity set
The investable private company universe is vast. Globally, there are approximately 25 times more privately held companies than publicly listed ones 7, providing a more diverse set of opportunities across industries, geographies, and growth stages. In the US, over 86 per cent of companies with over USD 100mn in annual revenues are private, with the remaining 14 per cent public companies 8.
Figure 5: Privately vs publicly owned companies
Number of global companies

Number of US companies worth > USD 100mn
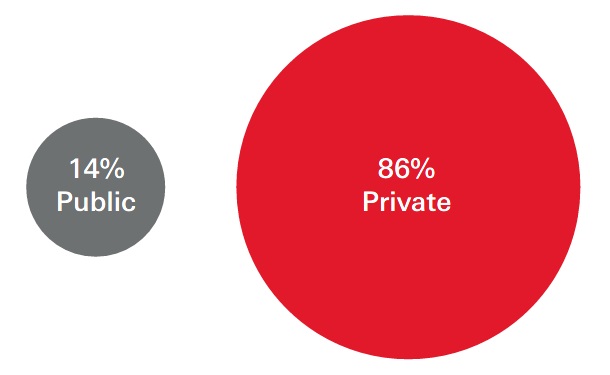
Source: HarbourVest (2025) and Blue Owl (2025)
Many of today’s most innovative and capital-efficient companies remain private for longer, preferring strategic partners who can help them build, rather than simply finance growth. Other companies avoid going public because of the additional investor scrutiny and burden of regulatory reporting requirements that accompany a public listing.
For private equity investors, this means access to the structural layers of the economy often absent from public market indices, including sector specialists, mid-market service providers, and upcoming technology platforms. The informational inefficiency within private markets provides opportunities for skilled managers to identify underappreciated and undervalued companies and transform them over the long term.
Historical track record and the illiquidity premium
Just as a well-constructed building will withstands floods and extreme weather, a differentiated and diversified private equity programme should demonstrate structural resilience to market shocks.
Recent research from MSCI finds that global private equity has outperformed public equity by about 450 basis points (bps) per year over the past two decades, with less than 100 bps due to higher leverage or market beta 9.
Figure 6: Fundamental characteristics explain a large share of private equity’s outperformance
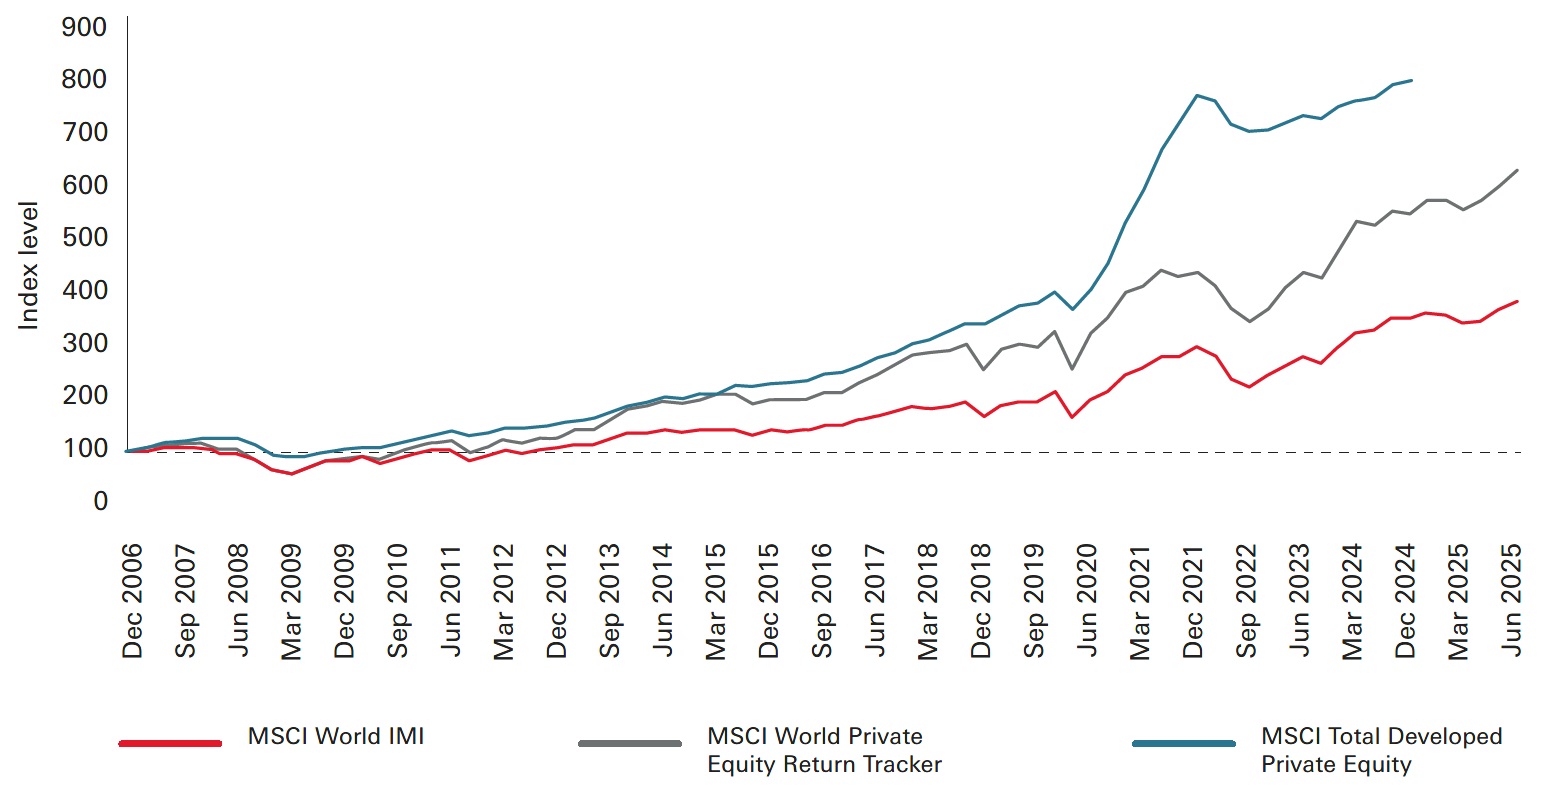
Source: MSCI (2025). The performance of the return tracker index has been intermediate to the global private and public equity markets. Index levels reflect the return in USD
Another study shows the performance of private equity funds through five previous ‘crises’ – the Dot-com Crash, Global Financial Crisis (GFC), Eurozone Crisis, COVID-19 Outbreak and the Return of Inflation 10. During each of these major disruptions, global private equity outperformed the MSCI ACWI Gross Index with an average annualised excess return of 8 per cent and outperformed the S&P 500 Total Return Index by an average of 4 per cent. Importantly, private equity portfolios also experienced less return volatility than equities.
In two major crises – the Dot-com crash and the Global Financial Crisis, private equity generated some of its best performing vintages 11. During the dot-com crash, private equity showed resilience, with a less significant downturn and a quicker recovery period compared to public markets. Managers capitalised on discounted valuations to yield significant long-term returns. Indeed, these were some of the strongest vintages in over two decades. Average total value to paid-in capital (TVPI) was 2.11x calculated seven years into the lifecycle of the fund.
In the wake of the global financial crisis, private equity-backed companies recovered faster and increased capital expenditure more during the crisis compared to comparable non-private equity-backed competitors. Because of this, they captured more market share and experienced higher asset growth, according to a study of almost 500 private equity-backed companies in the UK. TVPI was 1.51x again calculated seven years into the lifecycle of the fund.
Other outcomes of the GFC included enhanced governance and transparency with increasingly disciplined underwriting, for example, investors’ scrutiny on valuation policy and processes. Weaker managers with poor underwriting standards failed or restructured their businesses, creating opportunities for the better managers who could withstand market cycles and distressed periods to maintain deployment discipline.
Private equity can thrive during challenging market periods for several reasons:
- GPs with adequate dry powder can take advantage of disruption to purchase cheap distressed assets and ride the cycle
- Highly active involvement in portfolio companies helps them navigate crises more effectively than public companies
- GPs are not forced sellers of assets in down markets, as they can continue to hold and utilise secondaries which supports valuations
- Private equity usually invests in less cyclical, cash-generating, recurring revenue businesses (including in business services, technology, and healthcare) that are more resilient to macro shocks like the tariffs
In the long-term, private equity has outperformed public equity and has thrived during challenging market periods
A private equity construction plan
Given the multiple benefits of an allocation to private equity, how can investors build a resilient private equity portfolio? Below are key considerations for investors wanting to construct a durable, diversified programme for long-term value creation.
 The power of vintage diversification 12
Committing capital across successive fund years (or vintages) reduces the risk of entering the asset class at the wrong time. This smooths the J-curve effect and creates a pattern in which distributions from prior vintages help finance new commitments. Allocating over 4-6-year periods can help avoid market timing risk, providing diversification across interest rate cycles, valuations, and exit windows, thus smoothing returns.
Secondaries can play a key role in accelerating distributions and flattening the J-curve. With secondaries, LPs can gain exposure to mature, proven assets that have a track record, helping to avoid the blind pool risk associated with primary investments. Acquiring multiple secondary stakes across sectors and geographies also allows for greater diversification than single primary investments.
An effective vintage diversification approach can turn a sequence of discrete funds into a robust self-funding programme that maintains private equity exposure over time and achieves attractive risk-adjusted returns through market cycles.
 Manager selection and dispersion
The dispersion of returns between the top- and bottom-performing private equity managers can be significant and larger than that of public equity managers. It pays for investors to align with managers with stable teams that have a strong track record of disciplined underwriting, an edge in sourcing deals, and those that can realise exits effectively.
A 2025 review by McKinsey shows a 15 per cent median IRR gap between top- and bottom-quartile private equity funds from 2012-2021 13. Another study finds economically meaningful performance persistence among buyout fund managers 14.
 Sector allocation
Investors can benefit from allocating to sectors with clear structural tailwinds that will grow irrespective of short-term cycles and noise. Research shows that sector allocation plays a key role in private equity performance. In the MSCI study cited earlier of private equity outperformance relative to public equities, sector tilts and fundamentals explained around 200bps of the 450bps of outperformance. Aligning with a GP that chooses the right sectors is therefore as critical as manager selection.
Perhaps the most talked about sector is technology, encompassing artificial intelligence (AI), which is transforming how virtually every business operates. AI is defining the future, from automating healthcare and logistics, to powering the energy transition and financial technology.
Private equity investing allows access to the companies building the future, not just the large-cap giants, but also the mid-size firms developing software, data platforms, and digital tools that are making whole industries far more efficient. Long-term ownership of private companies that are at the forefront of this technological progress can anchor portfolios in the growth engines of the economy.
 Mid-market focus
While all areas of private equity offer attractive investment opportunities, the mid-market (usually classed as deals in the USD 1-3bn range) has key advantages:
- The mid-market contains a large and diverse opportunity set of companies that drive growth and innovation in the economy, with a favourable balance of growth potential and risk. Companies of this size have potential for significant growth from levers including operational improvements, geographic expansion, and product innovation
- Operational improvements are easier and quicker for GPs to make in mid-cap companies than larger, more complex companies due to greater control
- Sector depth and specialisation is much easier in a mid-market approach because of the focus on smaller companies, the ability of managers to have more control, and the potential for scalability
- The mid-market is traditionally less competitive than the large cap end due to fewer bidders and less intermediation as deals are sourced through local or proprietary connections. Entry multiples have been found by various studies to be lower than large-cap peers, allowing for greater multiple expansion 15
- There is greater exit optionality with mid-market companies compared to larger companies, where IPOs and M&A are more likely. This is beneficial in the recent environment of subdued exits
- Mid-market investments offer a degree of diversification for investors with large-cap public equity exposure
All these benefits can translate into strong historical performance 16. The most recent data shows mid-market managers achieving robust returns (9.3 per cent) in the year to Q4 2024 17, despite macro and policy uncertainty. Another study shows that lower mid-market and mid-market buyout funds tend to generate higher liquidity (DPI) than large cap funds in times of stability and market uncertainty alike18.
Investors can benefit from a targeted approach focused on leading specialised mid-cap managers. Often these GPs are hard-to-access so it can be beneficial to align with an investment partner that has a wide network and strong relationships with mid-market GPs.
There are strong reasons to suggest mid-market managers will benefit significantly in coming months as tariff uncertainty recedes, interest rates fall, and market conditions improve, supporting returns and distributions.
However, investors should be aware that there is potentially greater dispersion of returns and less liquidity in smaller fund sizes.
 Liquidity planning
Private equity is an illiquid investment, so liquidity needs should be anticipated and proactively addressed. This is especially true in the recent environment of subdued exits.
Investors can combine different approaches:
- Map commitments to expected distributions and review pacing periodically using cashflow tools, improving cashflow resilience. This analysis can be conducted for both base case and stress scenarios
- Implement a cash or short duration sleeve to meet calls during distribution shortfalls
- Allocate to more mature secondary investments to accelerate cashflows
 Fees, terms, and alignment
Alignment of interests between GPs and LPs was cited earlier as a key benefit of private equity. LPs should ensure alignment through agreement with managers on reasonable fees and carry, meaningful GP commitment, and transparent GP valuation and reporting.
The Institutional Limited Partners Association (ILPA) Private Equity Principles emphasise alignment, governance, and transparency and its templates standardise performance and cashflow reporting enabling LPs to compare GPs on a like-for-like basis 19.
To ensure alignment, investors should scrutinise GPs on their practices carefully. Two examples are understanding use-of-proceeds for GP NAV facilities to generate liquidity and agreeing fee terms for co-investments.
 Co-investments
In co-investments, the LP takes a minority stake in a company alongside the GP. This allows the investor to gain direct exposure to growing companies with greater transparency and typically lower risk and lower fees (sometimes no fees) compared to a traditional fund investment. The LP can use co-investments to tilt their portfolio towards a particular sector and/or geography, while leveraging the GPs control and governance framework.
While co-investments have multiple benefits, LPs should ensure they are not concentrating risk exposure excessively and that the GP is enforcing the same due diligence standards as the GP’s main funds. Service Level Agreement terms should be clear in terms of decision making and how and why such co-investment deals are allocated among LPs.
As co-investments become increasingly popular among LPs, there has been a trend for GPs to seek LPs that are ‘solution providers’, rather than just capital providers. These are LPs with execution capabilities and the required internal infrastructure that can co-underwrite, take syndication, and more actively partner with the GP. LPs that can play this role are more likely to access attractive co-investment deals.
Conclusion
The traditional closed-ended private equity model has endured for decades because it aligns long-term capital with active ownership and strong governance. Private equity managers can not only withstand market volatility, but also leverage it at challenging times, to generate sustainable value. For investors seeking portfolio resilience and attractive long-term returns, private equity remains a time-tested structure in modern investing.
1. Private Equity Outlook 2024: Industry Trends’, Bain & Company (2024) Private Equity Outlook 2024: Industry Trends | Bain & Company
2. IRR (Internal Rate of Return) is a money-weighted rate of return that captures the impact of the GP’s active decisions regarding the timing of capital calls, exits, and distributions over multiple years.
3. TVPI (Total Value to Paid-In) is the ratio of the total value of the investment or fund to the total capital paid in.
4. MOIC (Multiple on Invested Capital) is the ratio of the total value of the investment or fund to the initial capital invested.
5. The LPA is a key legal document that governs the relationship between the GP and the LPs, detailing the fund’s structure, investment strategy, and terms, including capital commitments, distributions, management fees, and carried interest. The LPA also defines the rights, responsibilities, and liabilities of both the GP and LPs.
6. 'Morgan Stanley tilts back to drawdown funds’, Citywire (2025) Au-Yeung: Morgan Stanley tilts back to drawdown funds
7. 'How does the size of private markets compare to public markets?’, HarbourVest (2025) How Does the Size of Private Markets Compare to Public Markets? - HarbourVest
8. 'The growing opportunity in private markets’, Blue Owl (2025).
9. 'Tracking Private Equity: Closing the Performance Gap’, MSCI (2025) Tracking Private Equity: Closing the Performance Gap | MSCI
10. 'Private Equity’s Resilience During Major Crises: a 25-Year Analysis’, Schroders Capital (2025) Private Equity’s Resilience During Major Crises: a 25-Year Analysis | Institutional Investor
11. 'The secret behind private equity’s strength during the dot-com crash and the great recession’, Moonfare (2022) Private equity during the dot-com crash and the great recession
12. Diversification does not ensure a profit or protect against loss
13. 'Braced for shifting weather’, McKinsey (2025) global-private-markets-report-2025-braced-for-shifting-weather.pdf
14. 'Has persistence persisted in private equity? Evidence from buyout and venture capital funds’, Harris et al (2025) Has persistence persisted in private equity? Evidence from buyout and venture capital funds - ScienceDirect
15. 'The mid-market: How private equity’s ‘engine room’ can drive alpha’, Pantheon (2024)
16. Past performance does not predict future returns.
17. 'Q2 2025 US PE Middle Market Report’, Pitchbook (2025)
18. 'Unlocking Liquidity: The Distribution Edge of Lower Mid-market Private Equity’, PGIM (2025) Unlocking Liquidity: The Distribution Edge of Lower Mid-market Private Equity
19. 'Overview of ILPA’s Private Equity Principles’, ILPA (2025)
Key risks
The views expressed above were held at the time of preparation and are subject to change without notice. Any forecast, projection or target where provided is indicative only and is not guaranteed in any way. HSBC Asset Management accepts no liability for any failure to meet such forecast, projection or target
- Alternatives risk: There are additional risks associated with specific alternative investments within the portfolios; these investments may be less readily reliable than others and it may therefore be difficult to sell in a timely manner at a reasonable price or to obtain reliable information about their value; there may also be greater potential for significant price movements
- Equity risk: Portfolios that invest in securities listed on a stock exchange or market could be affected by general changes in the stock market. The value of investments can go down as well as up due to equity markets movements
- Interest rate risk: As interest rates rise debt securities will fall in value. The value of debt is inversely proportional to interest rate movements
- Counterparty risk: The possibility that the counterparty to a transaction may be unwilling or unable to meet its obligations
- Derivatives risk: Derivatives can behave unexpectedly. The pricing and volatility of many derivatives may diverge from strictly reflecting the pricing or volatility of their underlying reference(s), instrument or asset
- Emerging markets risk: Emerging markets are less established, and often more volatile, than developed markets and involve higher risks, particularly market, liquidity and currency risks
- Exchange rate risk: Changes in currency exchange rates could reduce or increase investment gains or investment losses, in some cases significantly
- Investment leverage risk: Investment leverage occurs when the economic exposure is greater than the amount invested, such as when derivatives are used. A Fund that employs leverage may experience greater gains and/or losses due to the amplification effect from a movement in the price of the reference source
- Liquidity risk: Liquidity risk is the risk that a Fund may encounter difficulties meeting its obligations in respect of financial liabilities that are settled by delivering cash or other financial assets, thereby compromising existing or remaining investors
- Operational risk: Operational risks may subject the Fund to errors affecting transactions, valuation, accounting, and financial reporting, among other things
- Style risk: Different investment styles typically go in and out of favour depending on market conditions and investor sentiment
- Model risk: Model risk occurs when a financial model used in the portfolio management or valuation processes does not perform the tasks or capture the risks it was designed to. It is considered a subset of operational risk, as model risk mostly affects the portfolio that uses the model
Important information
For Professional Clients and intermediaries within countries and territories set out below; and for Institutional Investors and Financial Advisors in the US. This document should not be distributed to or relied upon by Retail clients/investors.
The value of investments and the income from them can go down as well as up and investors may not get back the amount originally invested. The performance figures contained in this document relate to past performance, which should not be seen as an indication of future returns. Future returns will depend, inter alia, on market conditions, investment manager’s skill, risk level and fees. Where overseas investments are held the rate of currency exchange may cause the value of such investments to go down as well as up. Investments in emerging markets are by their nature higher risk and potentially more volatile than those inherent in some established markets. Economies in Emerging Markets generally are heavily dependent upon international trade and, accordingly, have been and may continue to be affected adversely by trade barriers, exchange controls, managed adjustments in relative currency values and other protectionist measures imposed or negotiated by the countries and territories with which they trade. These economies also have been and may continue to be affected adversely by economic conditions in the countries and territories in which they trade.
The contents of this document may not be reproduced or further distributed to any person or entity, whether in whole or in part, for any purpose. All non-authorised reproduction or use of this document will be the responsibility of the user and may lead to legal proceedings. The material contained in this document is for general information purposes only and does not constitute advice or a recommendation to buy or sell investments. Some of the statements contained in this document may be considered forward looking statements which provide current expectations or forecasts of future events. Such forward looking statements are not guarantees of future performance or events and involve risks and uncertainties. Actual results may differ materially from those described in such forward-looking statements as a result of various factors. We do not undertake any obligation to update the forward-looking statements contained herein, or to update the reasons why actual results could differ from those projected in the forward-looking statements. This document has no contractual value and is not by any means intended as a solicitation, nor a recommendation for the purchase or sale of any financial instrument in any jurisdiction in which such an offer is not lawful. The views and opinions expressed herein are those of HSBC Asset Management at the time of preparation, and are subject to change at any time. These views may not necessarily indicate current portfolios' composition. Individual portfolios managed by HSBC Asset Management primarily reflect individual clients' objectives, risk preferences, time horizon, and market liquidity. Foreign and emerging markets. Investments in foreign markets involve risks such as currency rate fluctuations, potential differences in accounting and taxation policies, as well as possible political, economic, and market risks. These risks are heightened for investments in emerging markets which are also subject to greater illiquidity and volatility than developed foreign markets. This commentary is for information purposes only. It is a marketing communication and does not constitute investment advice or a recommendation to any reader of this content to buy or sell investments nor should it be regarded as investment research. It has not been prepared in accordance with legal requirements designed to promote the independence of investment research and is not subject to any prohibition on dealing ahead of its dissemination. This document is not contractually binding nor are we required to provide this to you by any legislative provision.
All data from HSBC Asset Management unless otherwise specified. Any third party information has been obtained from sources we believe to be reliable, but which we have not independently verified.
HSBC Asset Management is the brand name for the asset management business of HSBC Group, which includes the investment activities that may be provided through our local regulated entities. HSBC Asset Management is a group of companies in many countries and territories throughout the world that are engaged in investment advisory and fund management activities, which are ultimately owned by HSBC Holdings Plc. (HSBC Group). The above communication is distributed by the following entities:
- In Australia, this document is issued by HSBC Bank Australia Limited ABN 48 006 434 162, AFSL 232595, for HSBC Global Asset Management (Hong Kong) Limited ARBN 132 834 149 and HSBC Global Asset Management (UK) Limited ARBN 633 929 718. This document is for institutional investors only, and is not available for distribution to retail clients (as defined under the Corporations Act). HSBC Global Asset Management (Hong Kong) Limited and HSBC Global Asset Management (UK) Limited are exempt from the requirement to hold an Australian financial services license under the Corporations Act in respect of the financial services they provide. HSBC Global Asset Management (Hong Kong) Limited is regulated by the Securities and Futures Commission of Hong Kong under the Hong Kong laws, which differ from Australian laws. HSBC Global Asset Management (UK) Limited is regulated by the Financial Conduct Authority of the United Kingdom and, for the avoidance of doubt, includes the Financial Services Authority of the United Kingdom as it was previously known before 1 April 2013, under the laws of the United Kingdom, which differ from Australian laws;
- in Bermuda by HSBC Global Asset Management (Bermuda) Limited, of 37 Front Street, Hamilton, Bermuda which is licensed to conduct investment business by the Bermuda Monetary Authority;
- in Chile: Operations by HSBC's headquarters or other offices of this bank located abroad are not subject to Chilean inspections or regulations and are not covered by warranty of the Chilean state. Obtain information about the state guarantee to deposits at your bank or on www.cmfchile.cl;
- in Colombia: HSBC Bank USA NA has an authorized representative by the Superintendencia Financiera de Colombia (SFC) whereby its activities conform to the General Legal Financial System. SFC has not reviewed the information provided to the investor. This document is for the exclusive use of institutional investors in Colombia and is not for public distribution;
- in France, Belgium, Netherlands, Luxembourg, Portugal, Greece, Finland, Norway, Denmark and Sweden by HSBC Global Asset Management (France), a Portfolio Management Company authorised by the French regulatory authority AMF (no. GP99026);
- in Germany by HSBC Global Asset Management (Deutschland) GmbH which is regulated by BaFin (German clients) respective by the Austrian Financial Market Supervision FMA (Austrian clients);
- in Hong Kong by HSBC Global Asset Management (Hong Kong) Limited, which is regulated by the Securities and Futures Commission. This video/content has not be reviewed by the Securities and Futures Commission;
- in India by HSBC Asset Management (India) Pvt Ltd. which is regulated by the Securities and Exchange Board of India;
- in Italy and Spain by HSBC Global Asset Management (France), a Portfolio Management Company authorised by the French regulatory authority AMF (no. GP99026) and through the Italian and Spanish branches of HSBC Global Asset Management (France), regulated respectively by Banca d’Italia and Commissione Nazionale per le Società e la Borsa (Consob) in Italy, and the Comisión Nacional del Mercado de Valores (CNMV) in Spain;
- in Malta by HSBC Global Asset Management (Malta) Limited which is regulated and licensed to conduct Investment Services by the Malta Financial Services Authority under the Investment Services Act;
- in Mexico by HSBC Global Asset Management (Mexico), SA de CV, Sociedad Operadora de Fondos de Inversión, Grupo Financiero HSBC which is regulated by Comisión Nacional Bancaria y de Valores;
- in the United Arab Emirates, Qatar, Bahrain & Kuwait by HSBC Global Asset Management MENA, a unit within HSBC Bank Middle East Limited, U.A.E Branch, PO Box 66 Dubai, UAE, regulated by the Central Bank of the U.A.E. and the Securities and Commodities Authority in the UAE under SCA license number 602004 for the purpose of this promotion and lead regulated by the Dubai Financial Services Authority. HSBC Bank Middle East Limited is a member of the HSBC Group and HSBC Global Asset Management MENA are marketing the relevant product only in a sub-distributing capacity on a principal-to-principal basis. HSBC Global Asset Management MENA may not be licensed under the laws of the recipient’s country of residence and therefore may not be subject to supervision of the local regulator in the recipient’s country of residence. One of more of the products and services of the manufacturer may not have been approved by or registered with the local regulator and the assets may be booked outside of the recipient’s country of residence.
- in Peru: HSBC Bank USA NA has an authorized representative by the Superintendencia de Banca y Seguros in Perú whereby its activities conform to the General Legal Financial System - Law No. 26702. Funds have not been registered before the Superintendencia del Mercado de Valores (SMV) and are being placed by means of a private offer. SMV has not reviewed the information provided to the investor. This document is for the exclusive use of institutional investors in Perú and is not for public distribution;
- in Singapore by HSBC Global Asset Management (Singapore) Limited, which is regulated by the Monetary Authority of Singapore. The content in the document/video has not been reviewed by the Monetary Authority of Singapore;
- In Switzerland by HSBC Global Asset Management (Switzerland) AG. This document is intended for professional investor use only. For opting in and opting out according to FinSA, please refer to our website; if you wish to change your client categorization, please inform us. HSBC Global Asset Management (Switzerland) AG having its registered office at Gartenstrasse 26, PO Box, CH-8002 Zurich has a licence as an asset manager of collective investment schemes and as a representative of foreign collective investment schemes. Disputes regarding legal claims between the Client and HSBC Global Asset Management (Switzerland) AG can be settled by an ombudsman in mediation proceedings. HSBC Global Asset Management (Switzerland) AG is affiliated to the ombudsman FINOS having its registered address at Talstrasse 20, 8001 Zurich. There are general risks associated with financial instruments, please refer to the Swiss Banking Association (“SBA”) Brochure “Risks Involved in Trading in Financial Instruments;
- in Taiwan by HSBC Global Asset Management (Taiwan) Limited which is regulated by the Financial Supervisory Commission R.O.C. (Taiwan);
- in Turkiye by HSBC Asset Management A.S. Turkiye (AMTU) which is regulated by Capital Markets Board of Turkiye. Any information here is not intended to distribute in any jurisdiction where AMTU does not have a right to. Any views here should not be perceived as investment advice, product/service offer and/or promise of income. Information given here might not be suitable for all investors and investors should be giving their own independent decisions. The investment information, comments and advice given herein are not part of investment advice activity. Investment advice services are provided by authorized institutions to persons and entities privately by considering their risk and return preferences, whereas the comments and advice included herein are of a general nature. Therefore, they may not fit your financial situation and risk and return preferences. For this reason, making an investment decision only by relying on the information given herein may not give rise to results that fit your expectations.
- in the UK by HSBC Global Asset Management (UK) Limited, which is authorised and regulated by the Financial Conduct Authority;
- and in the US by HSBC Global Asset Management (USA) Inc. which is an investment adviser registered with the US Securities and Exchange Commission.
- In Uruguay, operations by HSBC's headquarters or other offices of this bank located abroad are not subject to Uruguayan inspections or regulations and are not covered by warranty of the Uruguayan state. Further information may be obtained about the state guarantee to deposits at your bank or on www.bcu.gub.uy.
Copyright © HSBC Global Asset Management Limited 2025. All rights reserved. No part of this publication may be reproduced, stored in a retrieval system, or transmitted, on any form or by any means, electronic, mechanical, photocopying, recording, or otherwise, without the prior written permission of HSBC Global Asset Management Limited.
Content ID: D058544; Expiry 30.11.2026